mRNA, lncRNA and circRNA in human biofluids
Tutorial
The tutorial of exoRBase 3.0 is as following:
- 1. Overview of exoRBase 3.0
- 2. Browse exoRBase 3.0
- 3. Search and results
- 4. Detail section
- 5. The relative proportions of EV origins
- 6. Other tips
exoRBase 3.0 aggregates 2,853 human RNA-seq datasets derived from extracellular vesicles and particles (EVPs) as well as cell-free RNAs (cfRNAs) collected from multiple biofluids. EVP libraries originate from blood, urine, cerebrospinal fluid (CSF) and bile, whereas cfRNA libraries come from blood, urine and CSF. The EVP cohort spans 12 cancer types, benign diseases and healthy controls; the cfRNA cohort covers 6 cancer types, 3 non-cancerous pathological states and healthy individuals. Additionally, colorectal cancer (CRC), hepatocellular carcinoma (HCC) and gastric cancer (GC) are represented in both datasets.
All raw reads were re-processed with an enhanced exLR-seq pipeline built on ASJA (Assembling Splice Junctions Analysis, https://github.com/HuangLab-Fudan/ASJA) and CIRI2 (CircRNA Identifier, https://sourceforge.net/projects/ciri/files/CIRI2/), yielding a comprehensive expression atlas comprising 19,927 mRNAs, 15,961 lncRNAs and 116,489 circRNAs in EVPs. For every sample, single-sample GSEA provided enrichment scores for 12,981 MSigDB pathways, while a modified EV-origin algorithm estimated the relative and absolute contributions of 16 tissue cell types and 23 blood cell types.
exoRBase 3.0 offers an intuitive platform for browsing, querying, visualizing and comparing RNA species, pathway signatures and cellular origins across EVP- and cfRNA-derived datasets from diverse human biofluids, thereby facilitating translational and basic research into extracellular RNA biology.
The “Browse” section includes four dedicated pages that allow users to explore mRNA and lncRNA, circRNA, Pathway, and Tissue/Cell origin data. Users can browse targets in the database with various filtering criteria. Using the “mRNA and lncRNA” page as an example, users can:
- (1) Select mRNA and lncRNA genes detected in “EVPs in Blood” samples;
- (2) Filter for mRNA and lncRNA genes specifically expressed in normal “Liver” tissue;
- (3) Identify mRNA and lncRNA genes downregulated in “EVPs in HCC” patients;
- (4) Quickly download the filtered results table in different formats, such as .csv, .txt, or .xlsx;
- (5) Search for specific genes of interest within the filtered results table and customize displayed columns;
- (6) Click to access detailed information pages for individual entries;
- (7) Click to directly view expression profile plots;
- (8) Set the number of entries displayed per page and navigate through pages.
| Column | Description |
|---|---|
| Related circRNA | Number of circRNAs annotated to this gene. |
| Detection frequency (EVPs) | Frequency of gene detection across all EVP samples. |
| Detection Status | Indicates whether the gene is detected only in EVPs, only in cfRNA, in both, or in neither. |
| Specificity score | Score reflecting the degree of specific expression of this gene in a particular normal tissue. |
| Tissue specificity | The specific normal tissue type where this gene shows tissue-specific expression. |
| Sample type | The types of samples in which this gene is detected. |
| Tumor mean (EVPs) | Mean expression value in blood EVP samples from tumor patients (TPM for mRNA/lncRNA, CPM for circRNA, ssGSEA score for pathways, or abundance for tissue/cell origin). |
| Benign mean (EVPs) | Mean expression value in blood EVP samples from patients with benign diseases (TPM, CPM, ssGSEA, or abundance as above). |
| Healthy mean (EVPs) | Mean expression value in blood EVP samples from healthy individuals (TPM, CPM, ssGSEA, or abundance as above). |
| Urine mean (EVPs) | Mean expression value in urine EVP samples (TPM, CPM, ssGSEA, or abundance as above). |
| CSF mean (EVPs) | Mean expression value in CSF EVP samples (TPM, CPM, ssGSEA, or abundance as above). |
| Bile mean (EVPs) | Mean expression value in bile EVP samples (TPM, CPM, ssGSEA, or abundance as above). |
| Diff group | Indicates the group(s) where the gene shows significantly upregulated or downregulated expression compared to the healthy group. |
Note: Columns labeled with “(EVPs)” represent expression statistics or detection metrics calculated specifically from EVP samples. Corresponding columns without the “(EVPs)” suffix provide the same metrics calculated across all cfRNA samples. For example, Detection Frequency (EVPs) reports the frequency in EVP-derived samples, while Detection Frequency without parentheses indicates the frequency across cfRNA-derived samples. This naming convention applies consistently to other similar pairs of columns in the browse result table.
By clicking the “Search” tab in the top navigation menu, users can access the search section from any page within the database. Users may search for mRNAs, lncRNAs, circRNAs, pathways, or tissue/cell origins of interest by entering a comma-separated list of gene symbols, circRNA IDs, pathway IDs/names, or tissue/cell names on the corresponding search page.
Taking the mRNA and lncRNA search as an example, the search workflow includes:
- (1) A simple search box only for mRNA and lncRNA genes on the homepage;
- (2) A quick search box only for mRNA and lncRNA genes available on other pages;
- (3) A comprehensive search box for mRNA and lncRNA genes on the dedicated search page;
- (4) A line chart displaying the raw average expression values of queried genes across all cohorts;
- (5) A heat map chart presenting the normalized average expression values of queried genes across all cohorts;
- (6) The option to export search results in various formats.
Clicking on a gene symbol, circRNA ID, pathway ID, or tissue/cell name in either the browse or search result tables will navigate users to the corresponding detail section, which now includes three dedicated pages: Summary, Profile, and Comparison.
For exLRs derived from EVP- or cfRNA-based samples, the Summary page provides comprehensive annotation details, including expression frequencies (number of positive samples) and mean expression levels across tumor, benign, healthy, urine, CSF, and bile samples. Notably, compared to exoRBase 2.0, exoRBase 3.0 introduces the ability to directly compare gene expression between EVP-derived and cfRNA-derived samples, enabling more nuanced investigations of extracellular RNA profiles across different biofluid components.
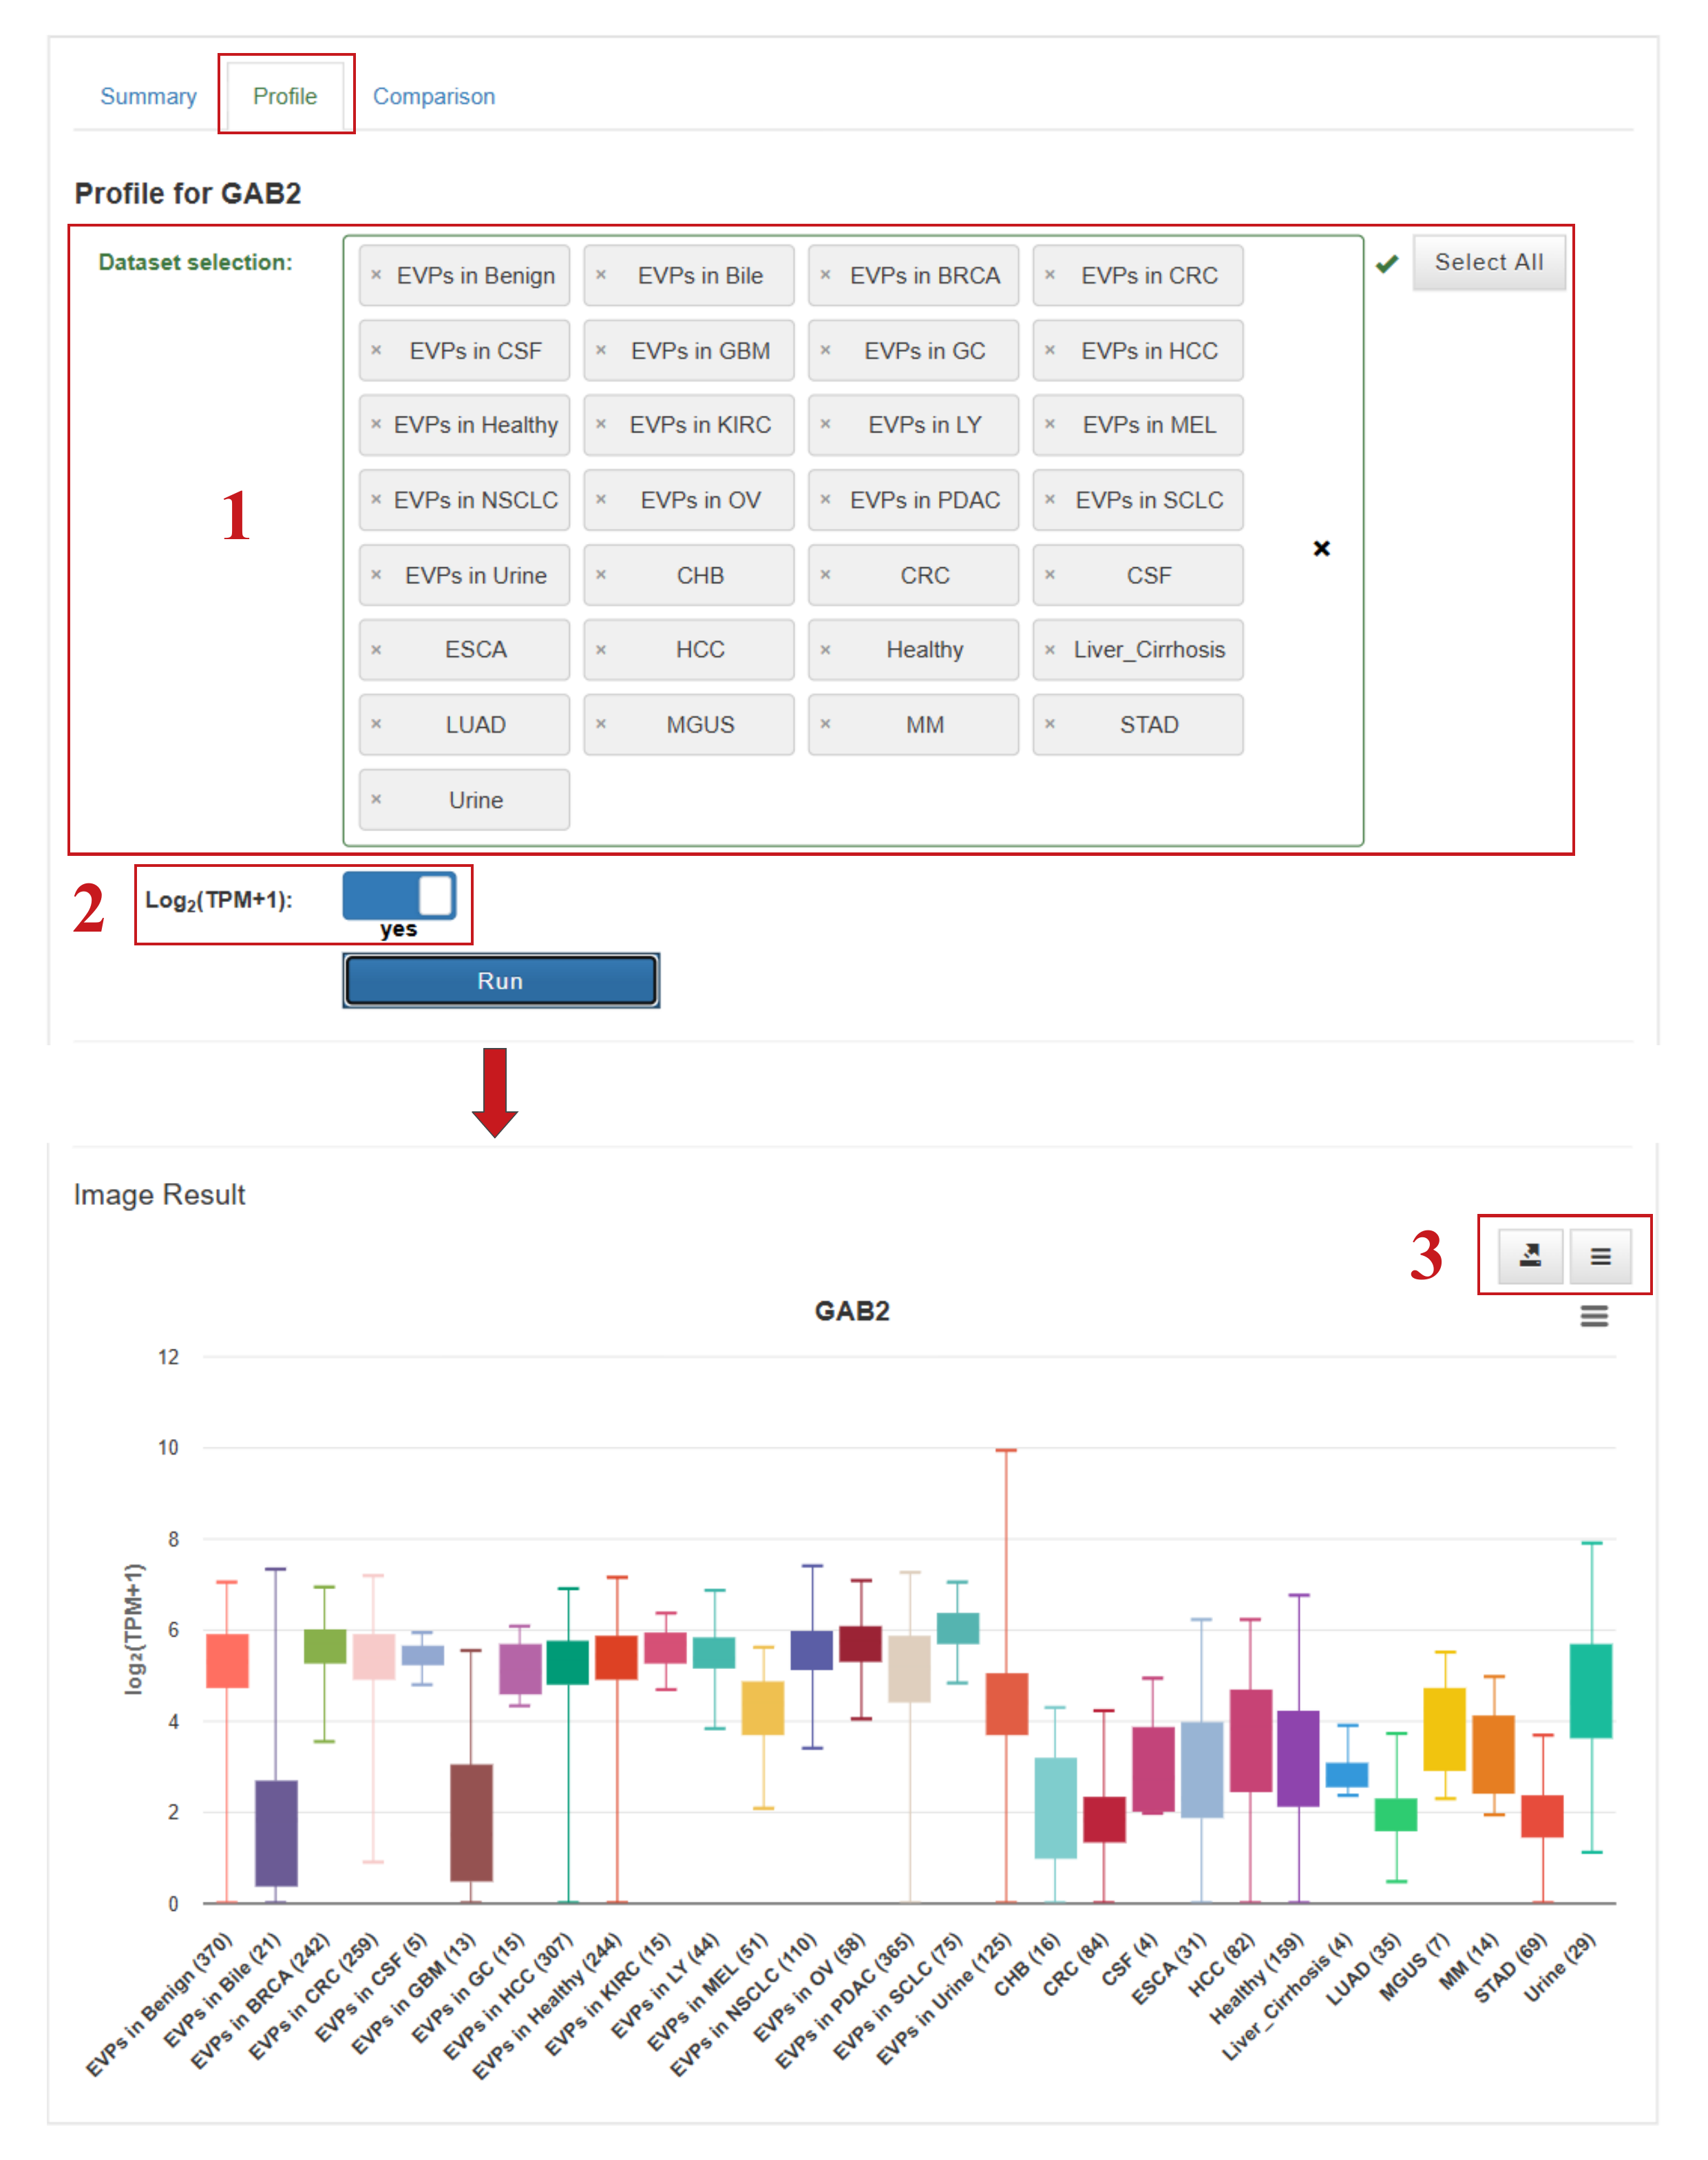
The Profile and Comparison pages offer several interactive options to customize analyses:
- (1) Select datasets of interest to visualize expression levels;
- (2) Choose whether to display normalized or raw expression values;
- (3) Download charts and underlying data in preferred formats;
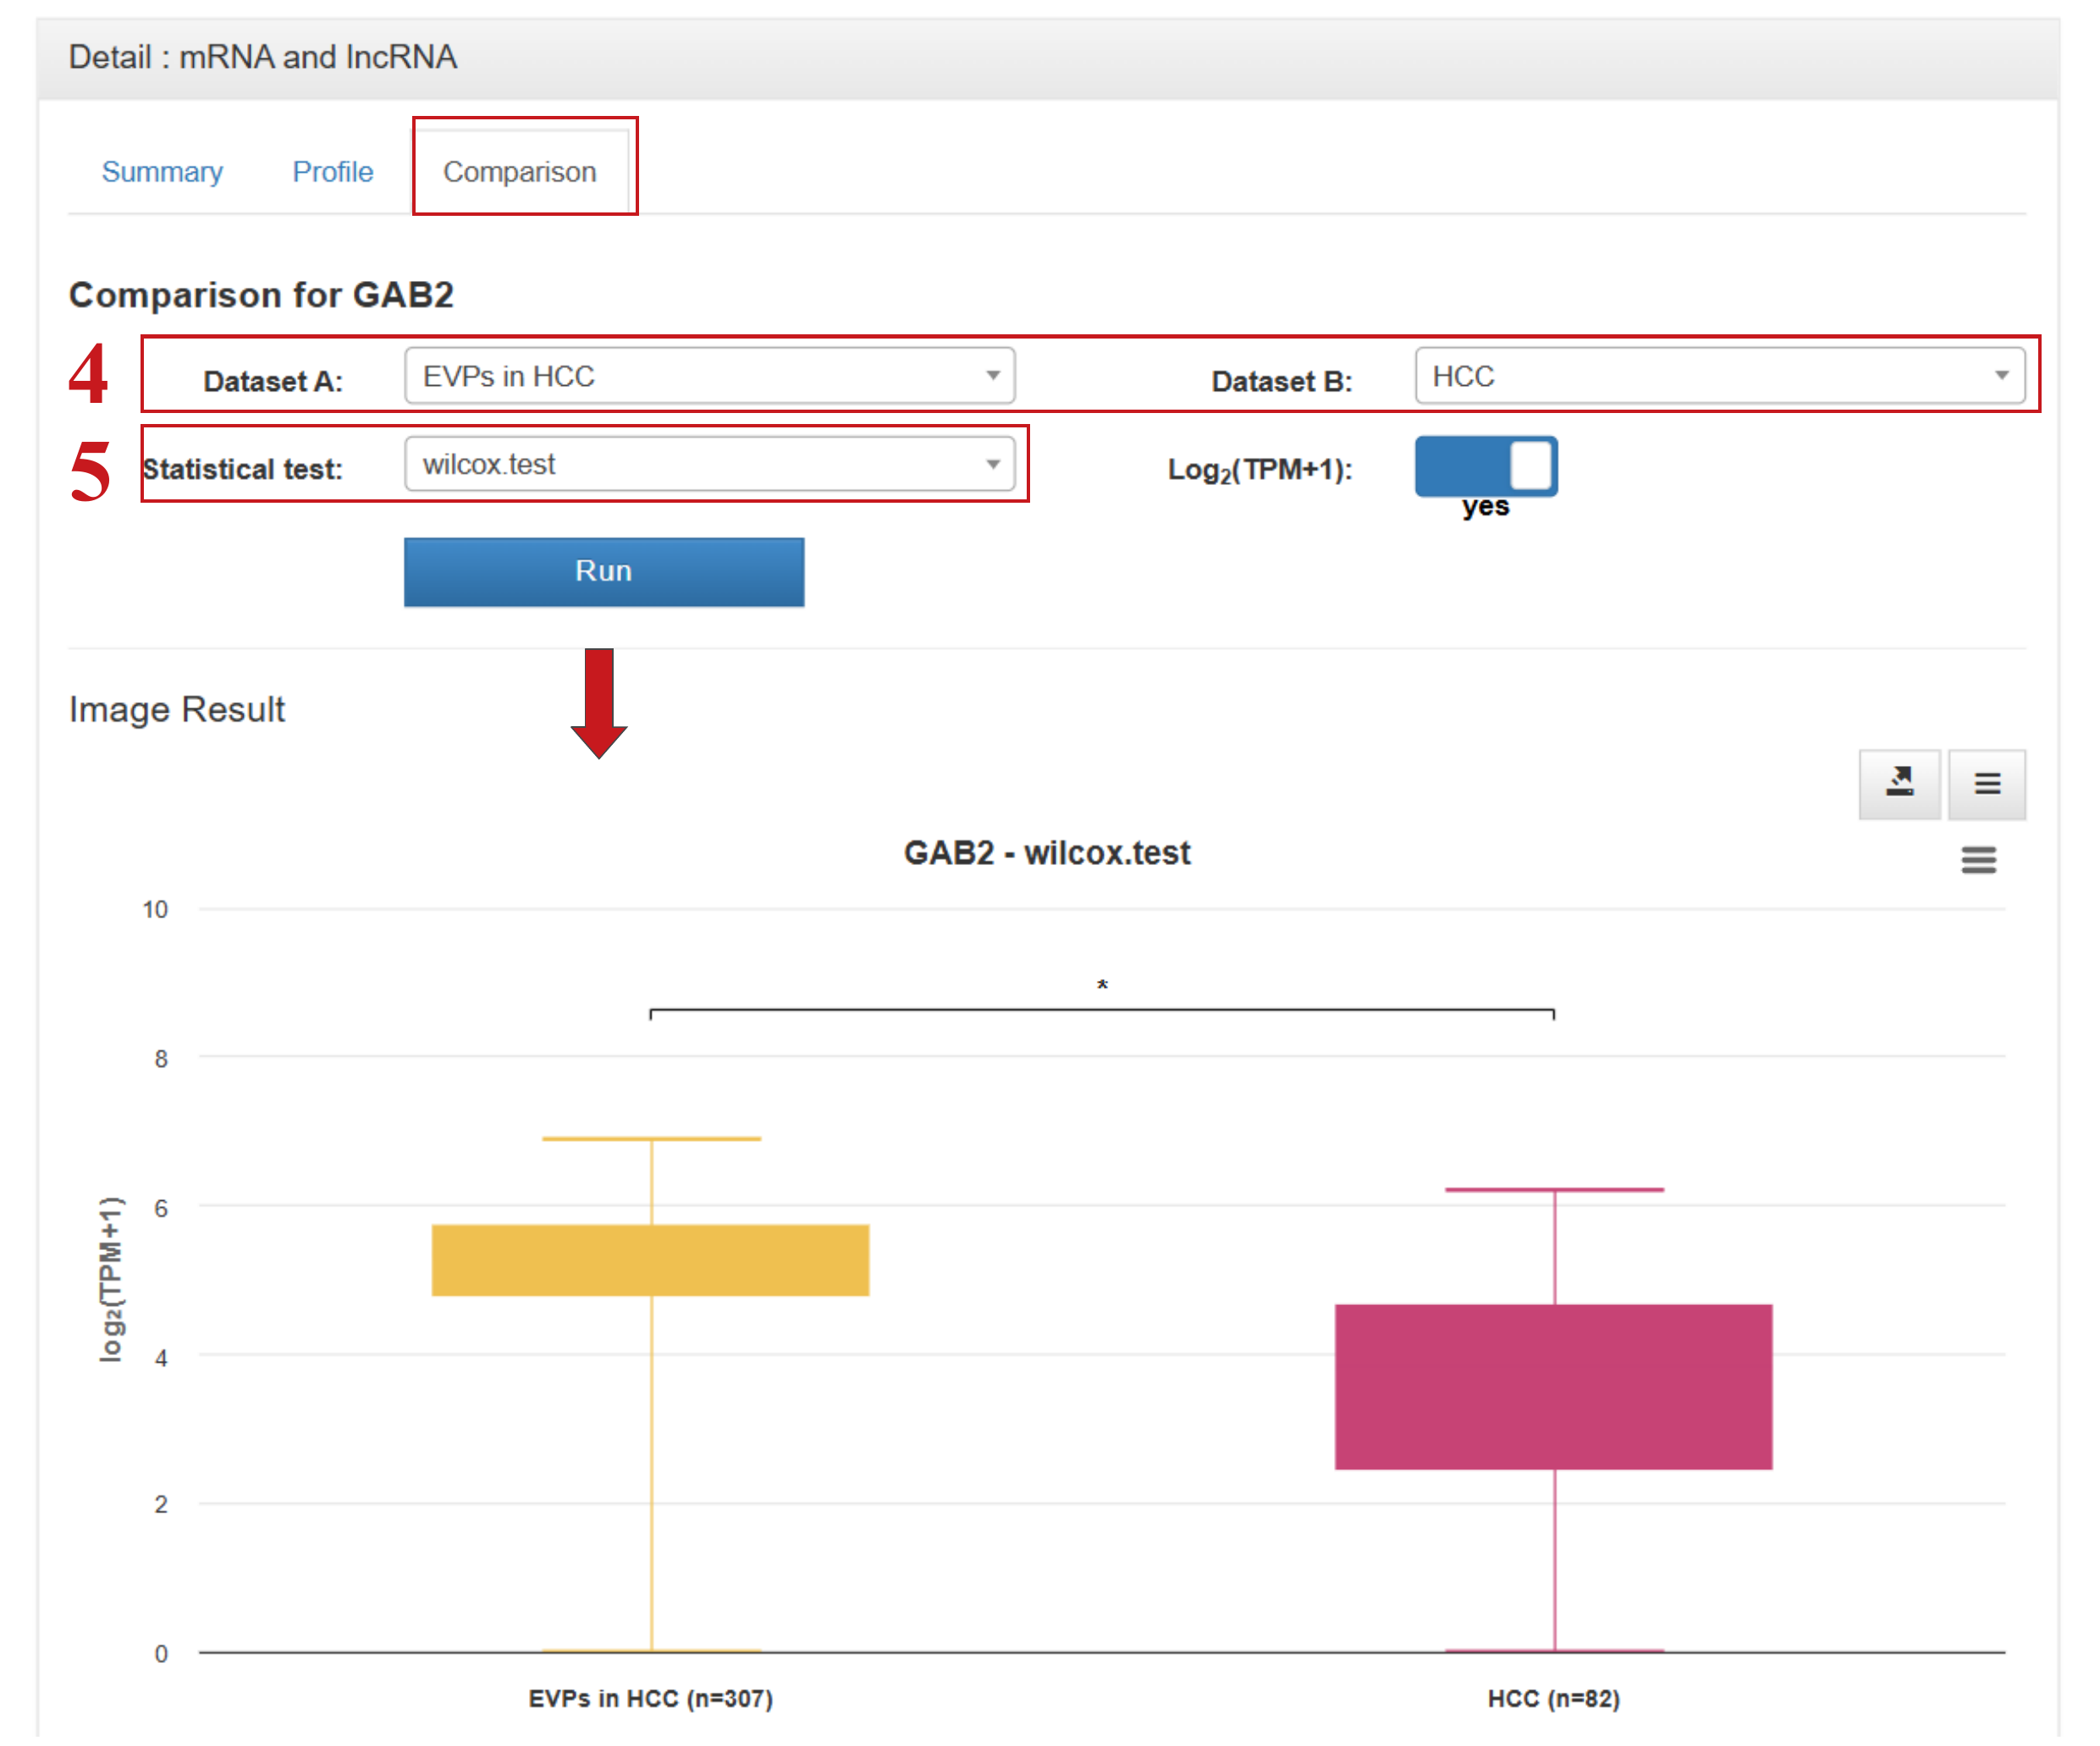
- (4) Select two datasets of interest for direct comparison—specifically supporting comparisons between EVP- and cfRNA-derived samples;
- (5) Choose an appropriate statistical test to evaluate differences between groups: Student’s t-test for groups with fewer than 30 samples, or Wilcoxon rank-sum test for groups with 30 or more samples.
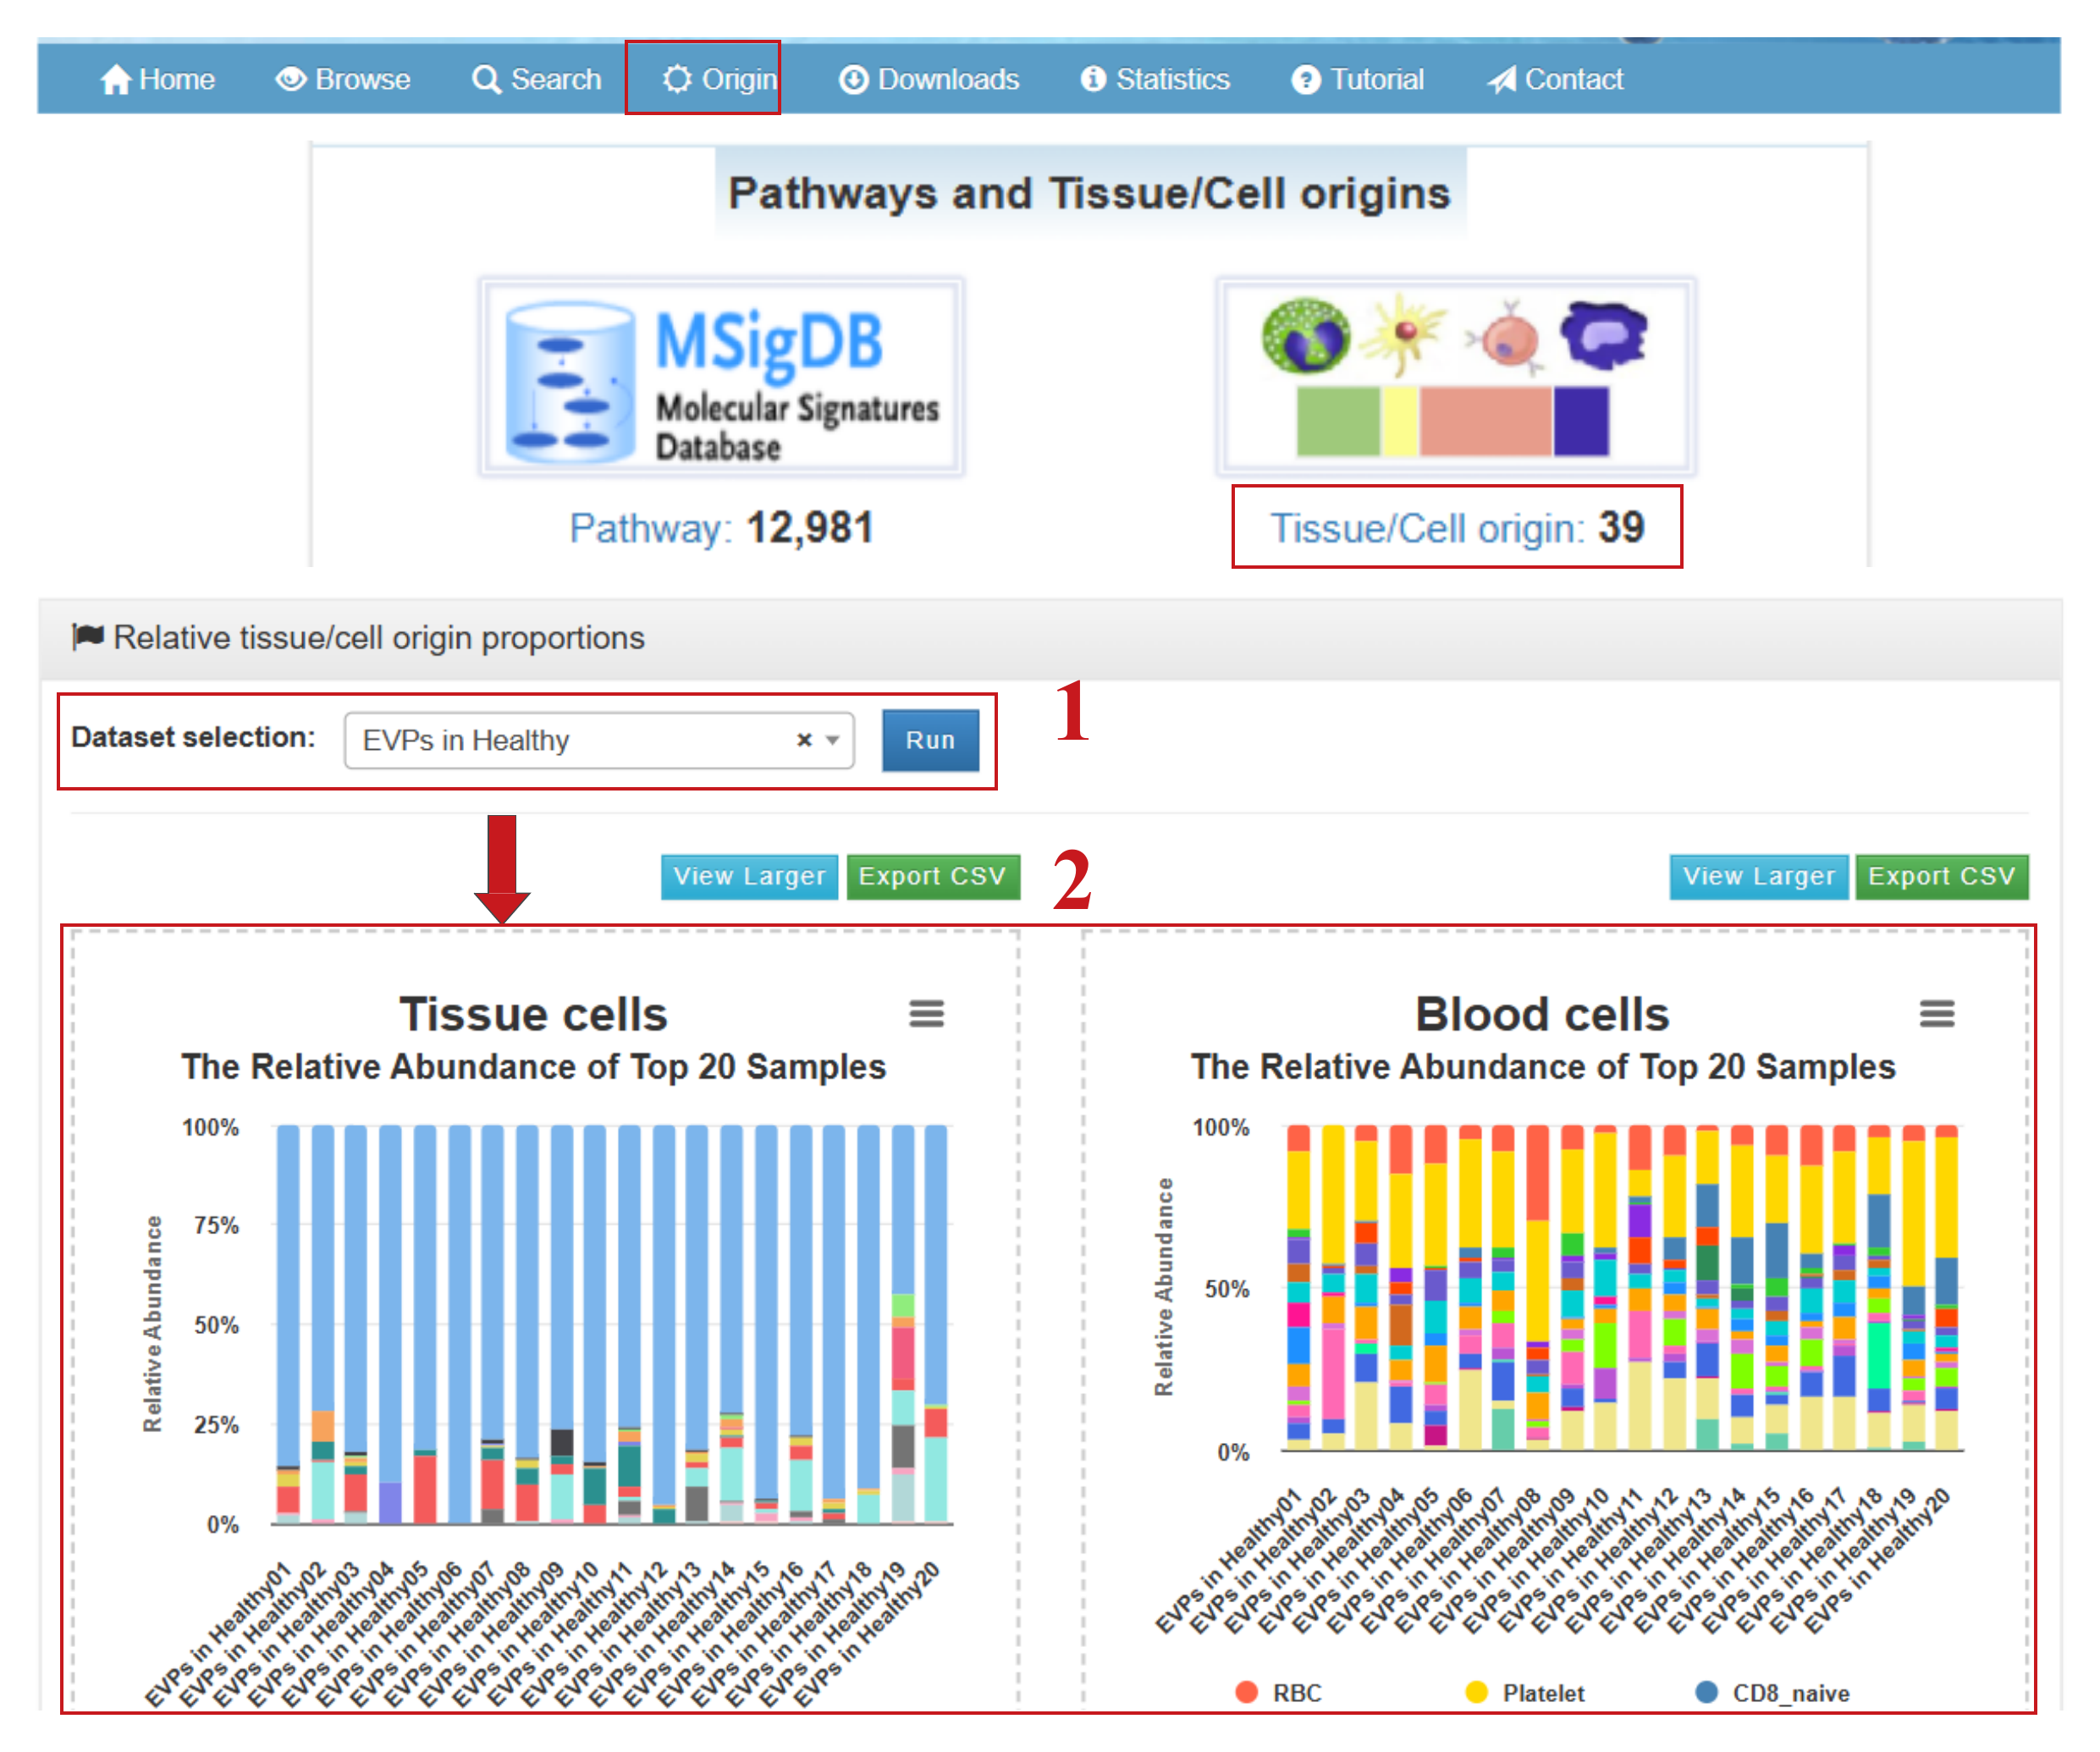
5. The relative proportions of EV origins
exoRBase 3.0 enables intuitive visualization of both the absolute and relative proportions of tissue and cell origins, allowing users to compare distributions across cohorts or within individual samples. By clicking “Origin” in the navigation bar or “Tissue/Cell Origin” on the homepage, users can access the Relative Tissue/Cell Origin Proportions page, which provides the following functionalities:
- (1) Select a dataset of interest (e.g., EVPs in Healthy individuals);
- (2) View cumulative percentage charts illustrating the relative abundances of 16 tissue origins and 23 blood cell origins for the top 20 healthy samples (or for all samples in a group containing fewer than 20 samples);
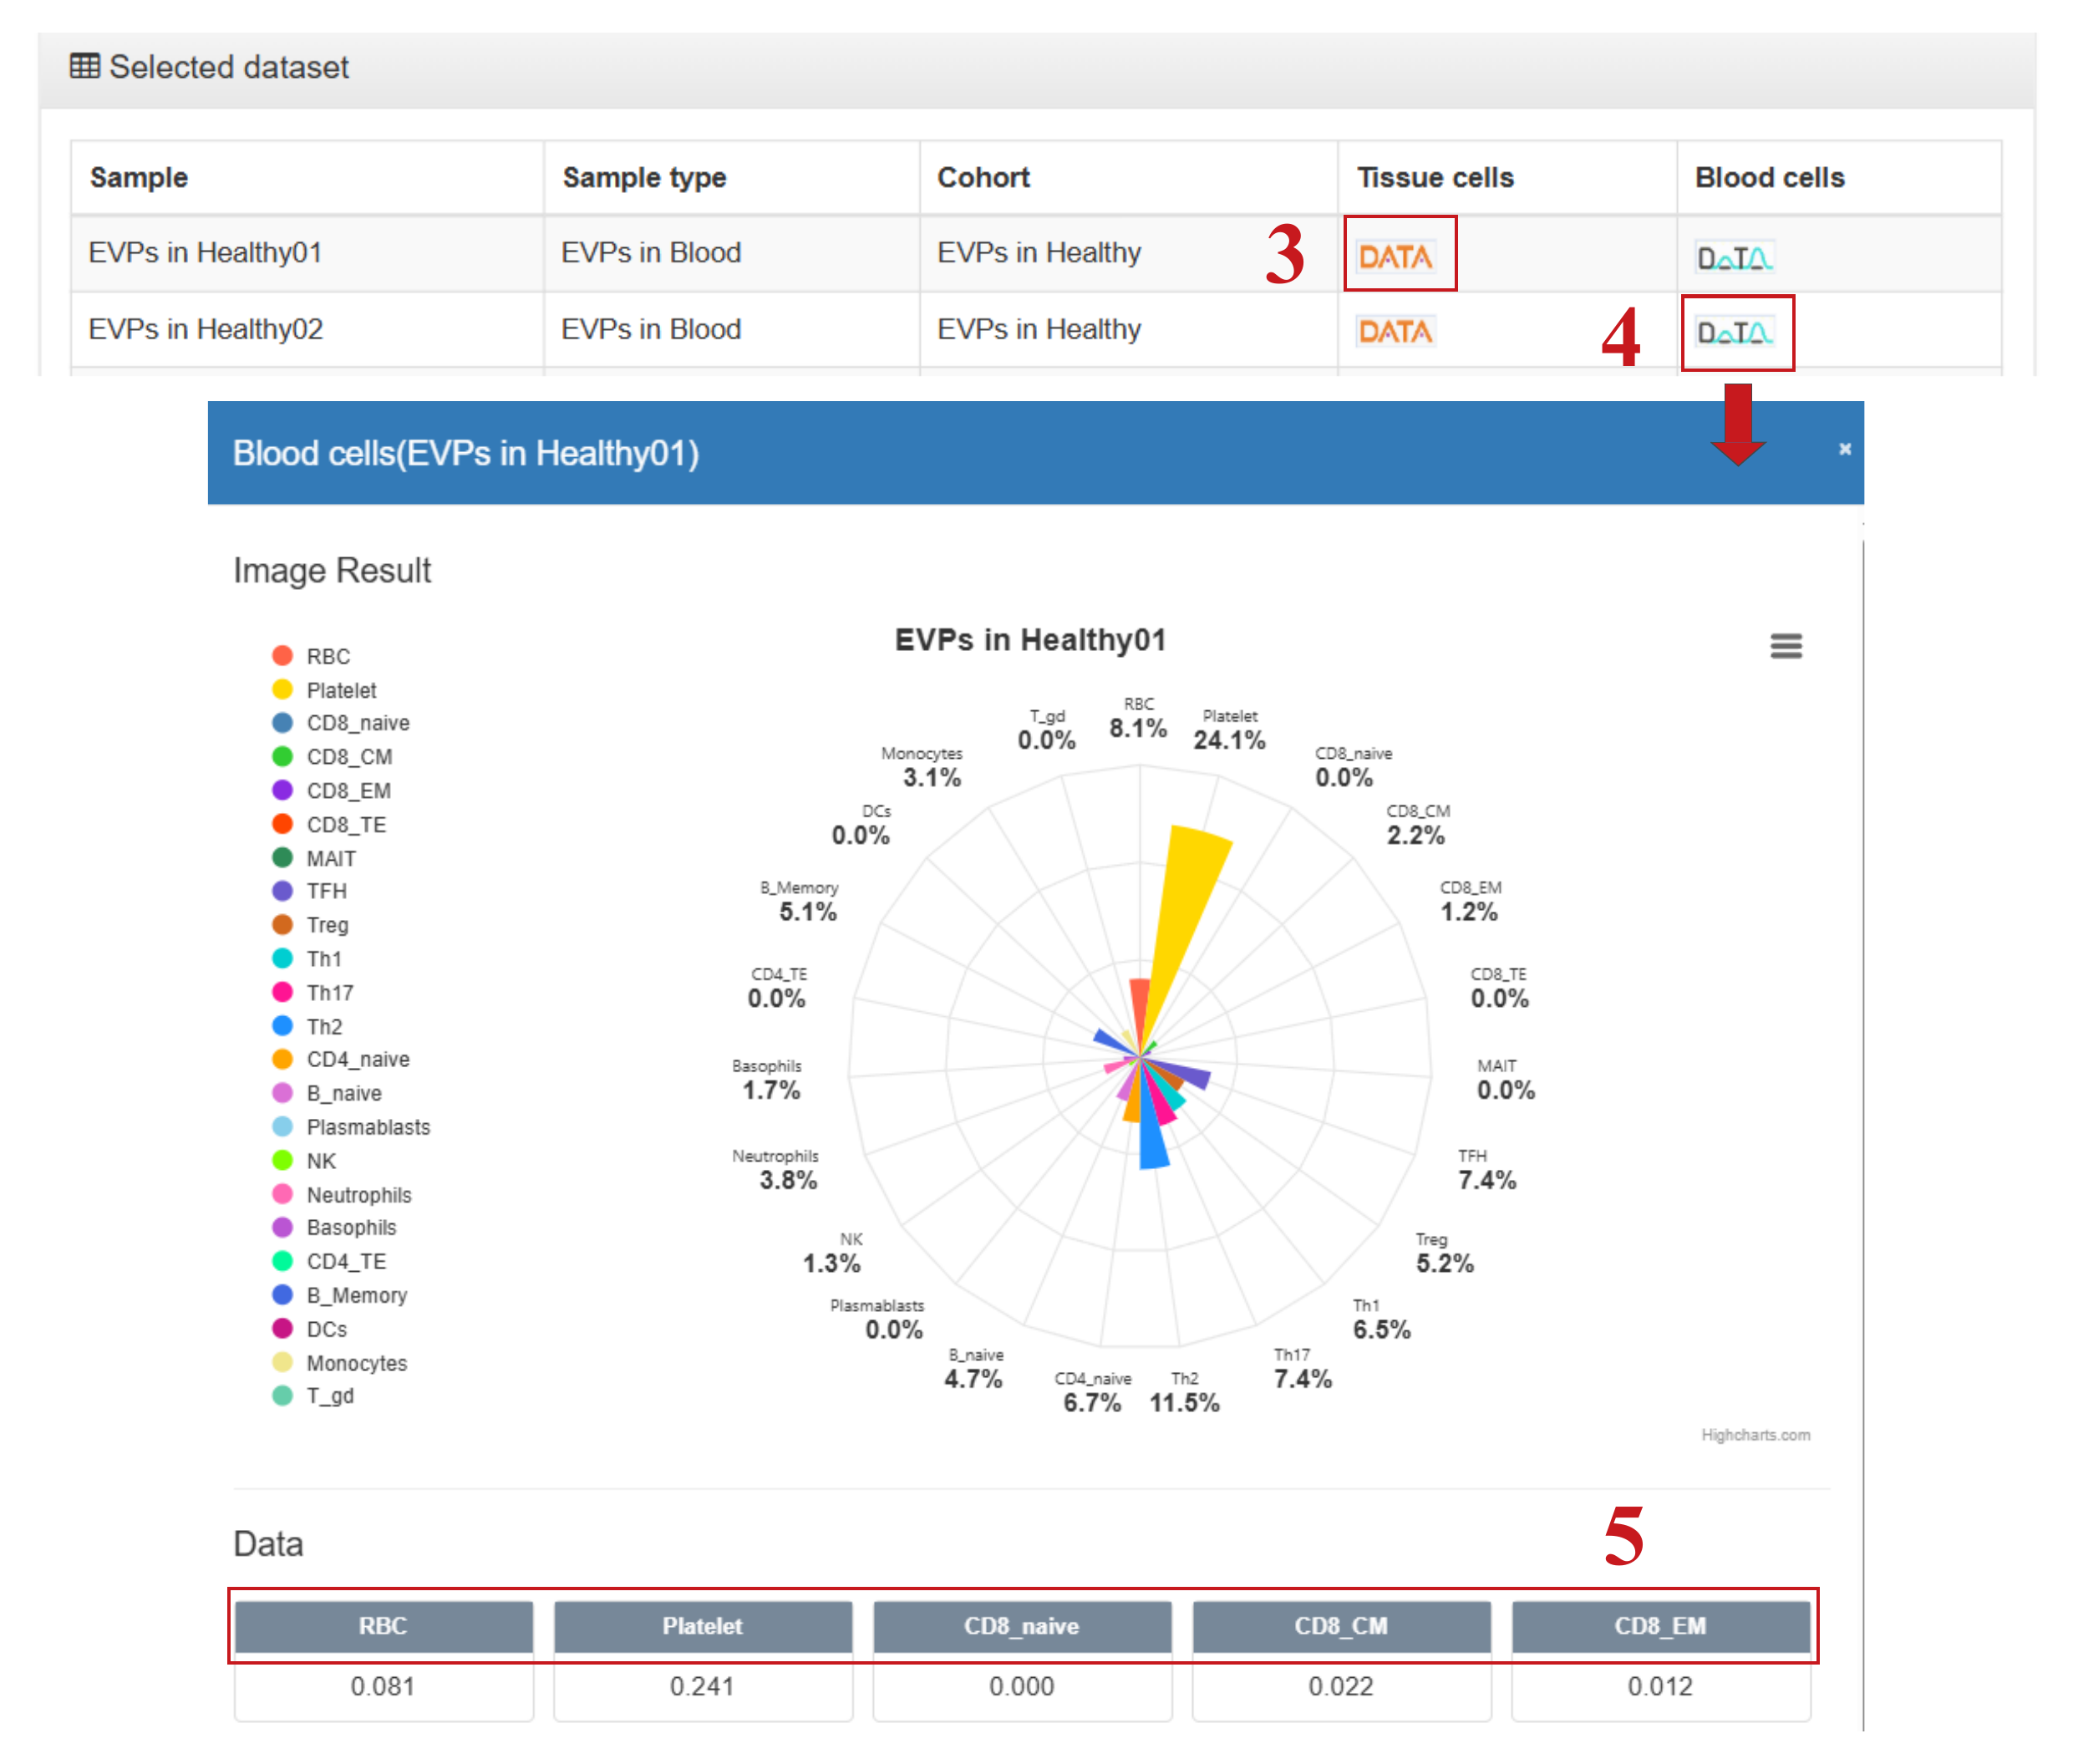
- (3) Click to display a rose (polar) chart of the relative proportions of tissue origins;
- (4) Click to display a rose (polar) chart of the relative proportions of blood cell origins;
- (5) Click to navigate directly to the detailed page for the corresponding EV origin.
(1) Calculation of tissue specificity for mRNA or lncRNA genes
To evaluate the tissue specificity of mRNA and lncRNA genes across human tissues, we downloaded the latest release (RNA-seq analysis V8) of gene expression TPM profiles (GENCODE v26) spanning 30 tissues from the Genotype-Tissue Expression (GTEx) project. Genes with low expression levels (<0.1 TPM) in all tissues were excluded. Tissue specificity was quantified using a score defined as the difference between the logarithm of the total number of tissues and the Shannon entropy of the gene’s expression distribution across tissues. Specifically, the score was calculated as follows:
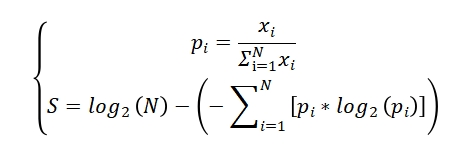
Where xi is the expression level of the gene in tissue i, N is the total number of all tissues, and pi represents the relative frequency of the gene in tissue i. For each gene, 30 frequency scores (pi) and a single specificity score were computed. A gene was defined as tissue-specific if its highest frequency score was at least twice the second highest, and its specificity score was no less than 1.
(2) Annotation of circRNAs with circBase database
All human circRNA sequences were downloaded from the circBase database (http://www.circbase.org/). The genomic coordinates of these circRNAs were converted to the hg38 reference genome using the UCSC LiftOver tool. The converted circRNAs were then integrated with our circRNA collections.
(3) Definition of significant differences between healthy and disease groups
To identify differentially expressed or enriched targets, differential analysis was performed between disease or tumor cohorts and healthy controls based on EVP sequencing data. For the EVP-sequenced healthy group, which included 244 samples, differential analysis for cohorts with smaller sample sizes (e.g., BRCA, GC, GB, KIRC, MEL, ML, OV, SCLC, and NSCLC) was conducted by randomly selecting an equal number of healthy EVPs samples to ensure balanced comparisons. For cohorts with larger sample sizes (e.g., Benign, CRC, HCC, and PDAC), the number of samples was matched to the healthy EVPs group for consistency in analysis. Similarly, for non-EVP liquid biopsy cfRNA sequencing data, differential analysis was performed by comparing disease or tumor samples with non-EVP cfRNA-sequenced healthy controls, applying the same strategy of matching sample numbers to maintain balance.
For transcript selection, long RNAs (including lncRNAs and mRNAs) and circRNAs were considered significant if they met the criteria of |log₂ fold change| > 1 and p-value < 0.05. Enrichment results from pathway analyses and the EV-origin strategy were included if they satisfied the criterion of p-value < 0.05. This approach ensured robust identification of differentially expressed targets across all sample groups while mitigating potential biases due to sample size imbalances.