mRNA, lncRNA and circRNA in extracellular vesicles
Tutorial
The tutorial of exoRBase 2.0 is as following:
-
 1. Overview of exoRBase 2.0
-
2. Browse exoRBase 2.0
-
3. Search and results
-
4. Detail section
-
5. The relative proportions of EV origins
-
6. Other tips
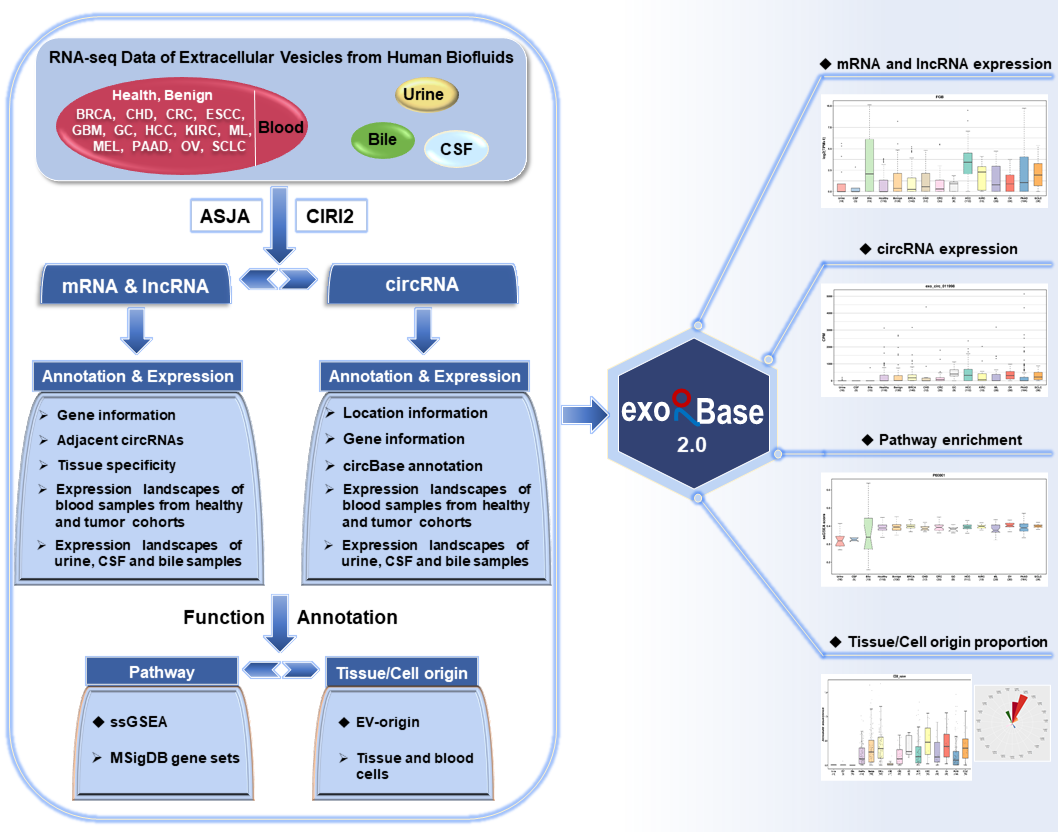
A total of 905 RNA-seq data of extracellular vesicles (EVs) from human blood, urine, cerebrospinal fluid (CSF) and bile samples were collected and compiled into exoRBase 2.0 database. These blood samples were associated with diverse biological conditions, including healthy state, benign disease and 13 types of cancer.
Referring to the ASJA (Assembling Splice Junctions Analysis, https://github.com/HuangLab-Fudan/ASJA) and CIRI2 (CircRNA Identifier, https://sourceforge.net/projects/ciri/files/CIRI2/) bioinformatic tools,
we employed an improved exLR-seq analysis pipeline to reanalyze the raw sequencing data of all samples. The annotation information and expression profiles of 19,643 mRNAs, 15,645 lncRNAs and 79,084 circRNAs in EVs were obtained. We also covered the enrichment scores of 11,536 MSigDB (Molecular Signatures Database) pathways for each sample generated by ssGSEA (single sample Gene set Enrichment Analysis) analyses on exLR expression profiles. In addition, exoRBase 2.0 provides the relative and absolute distribution of 16 types of tissue cells and 23 types of blood cells produced by the modified EV-origin approach. This database enables users to ExoRBase 2.0 enables users to browse, search, visualize and compare mRNAs, lncRNAs, circRNAs, pathways, origins of EVs.
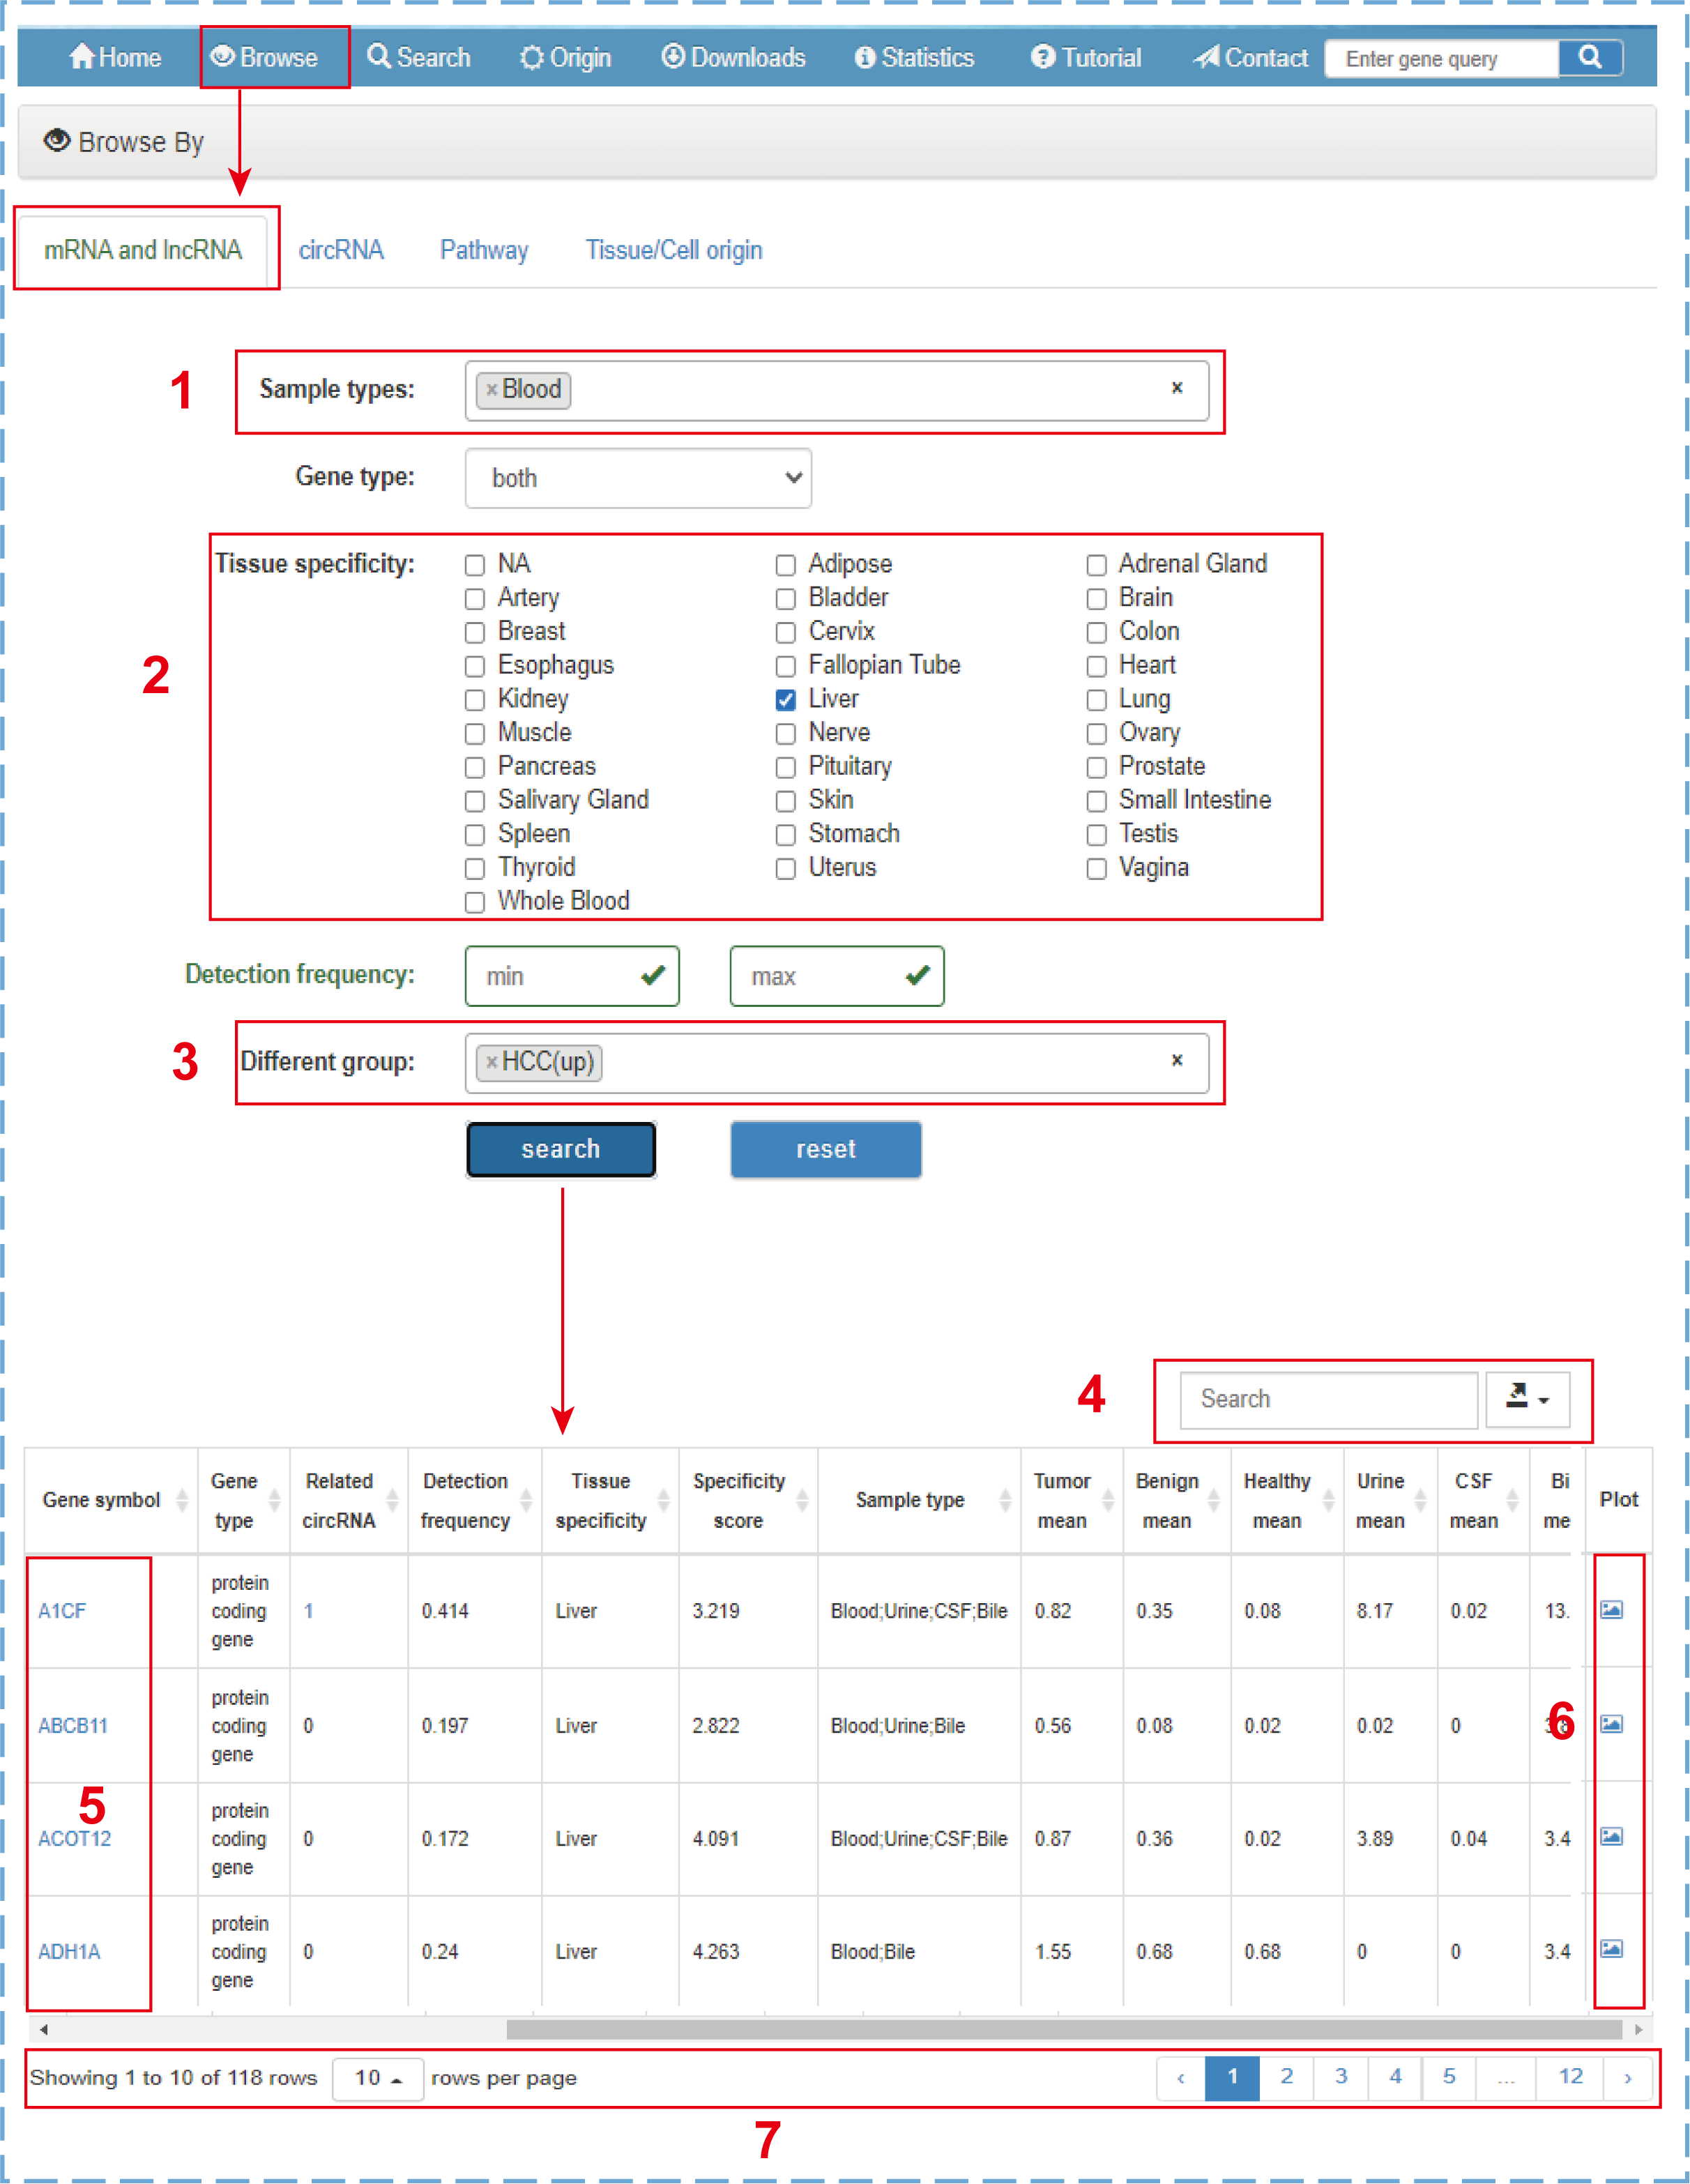
In the browse section, there are four web pages for users to browse mRNA, lncRNA, circRNA, Pathway, or Tissue/Cell origin. Users can browse targets in this database with different filter criteria. Taking the ‘mRNA and lncRNA’ as an example:
- 1.Selecting mRNA and lncRNA genes detected in ‘Blood’ samples;
- 2.Choosing mRNA and lncRNA genes specifically expressed in normal ‘Liver’ tissue;
- 3.Screening mRNA and lncRNA genes upregulated in ‘HCC’ patients;
- 4.Quickly searching or downloading the filtered browse table;
- 5.Clicking to link to the detailed information of this entry;
- 6.Clicking to directly connect to the profile graph;
- 7.Setting the number of entries displayed per page and turning the page.
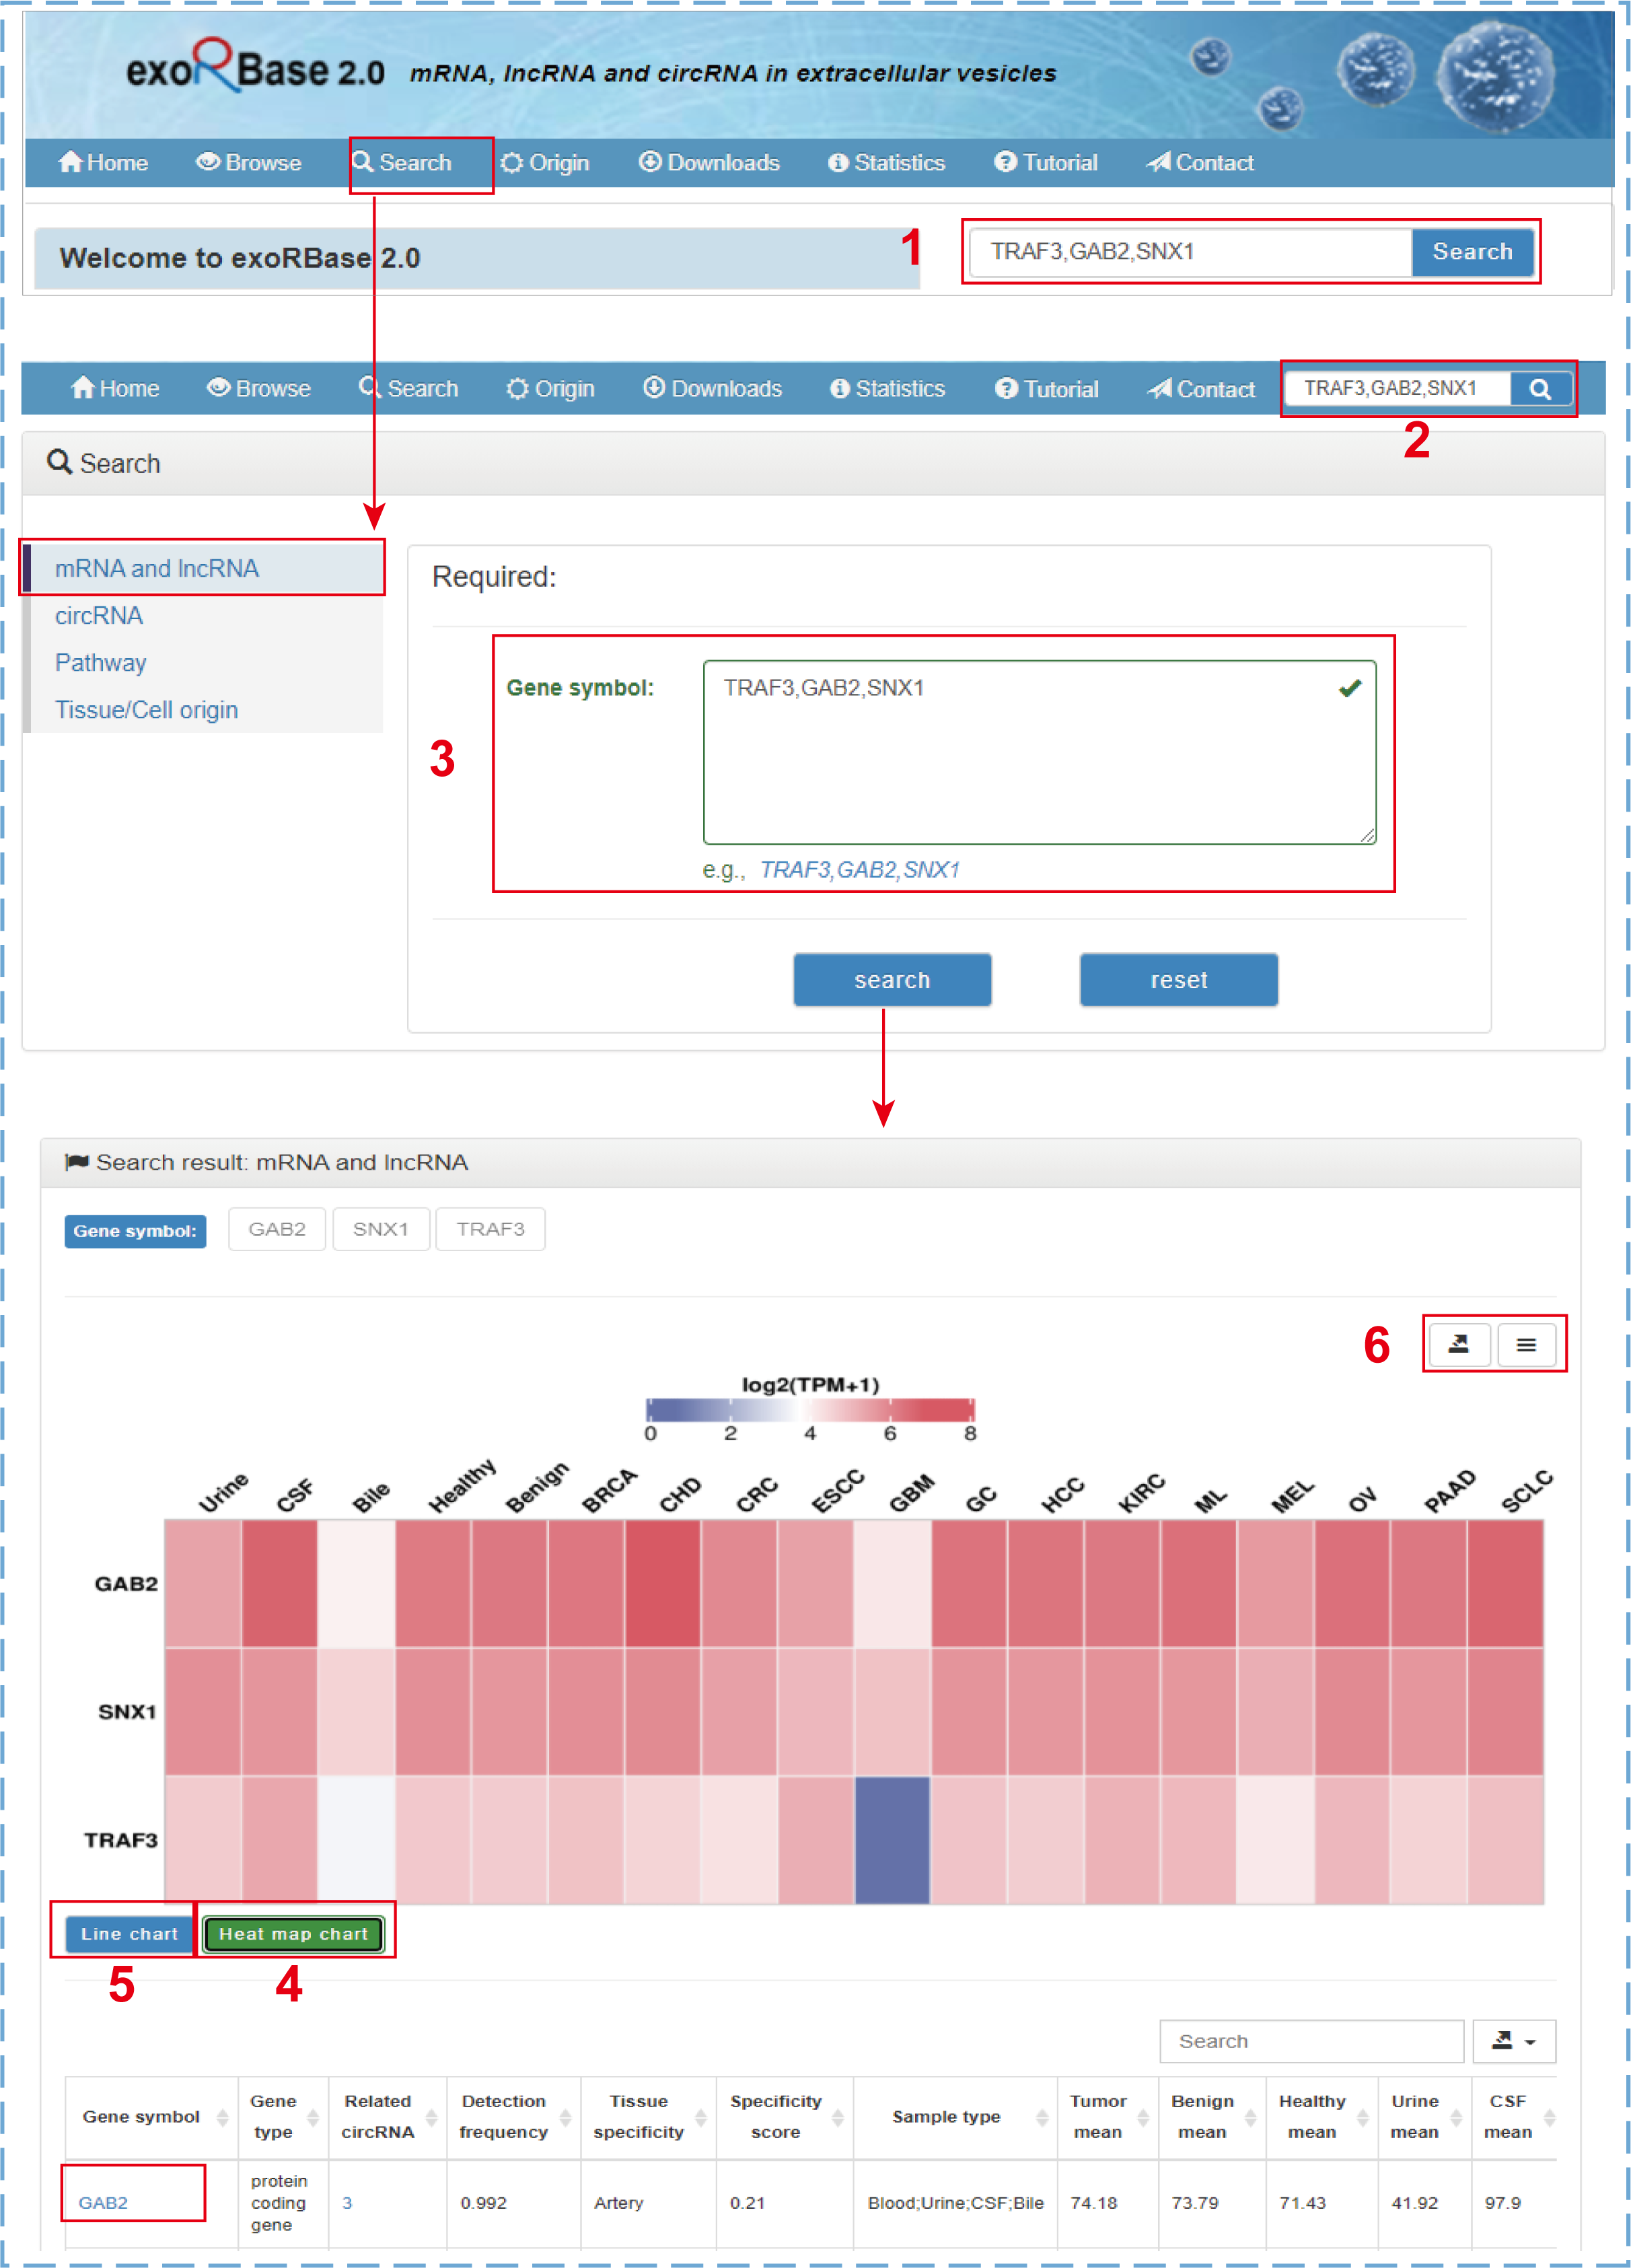
By clicking the ‘Search’ tab on the top navigation menu, users will jump to the search section from any pages. Users can search their mRNAs, lncRNAs, circRNAs, pathways, or tissue/cell origins of interest by entering a comma-separated list of gene symbols, circRNA IDs, pathway IDs/names, or tissue/cell names on the corresponding search page. The search and results for mRNA and lncRNA genes is illustrated by the following figure:
- 1.The simple search box only for mRNA and lncRNA genes on the home page;
- 2.The quick search box only for mRNA and lncRNA genes on other pages;
- 3.The search box for mRNA and lncRNA genes on the search page;
- 4.The heat map chart shows the normalized average expression values of genes across all cohorts;
- 5.The line chart shows the raw average expression values of genes across all cohorts;
- 6.Clicking to download charts and data.
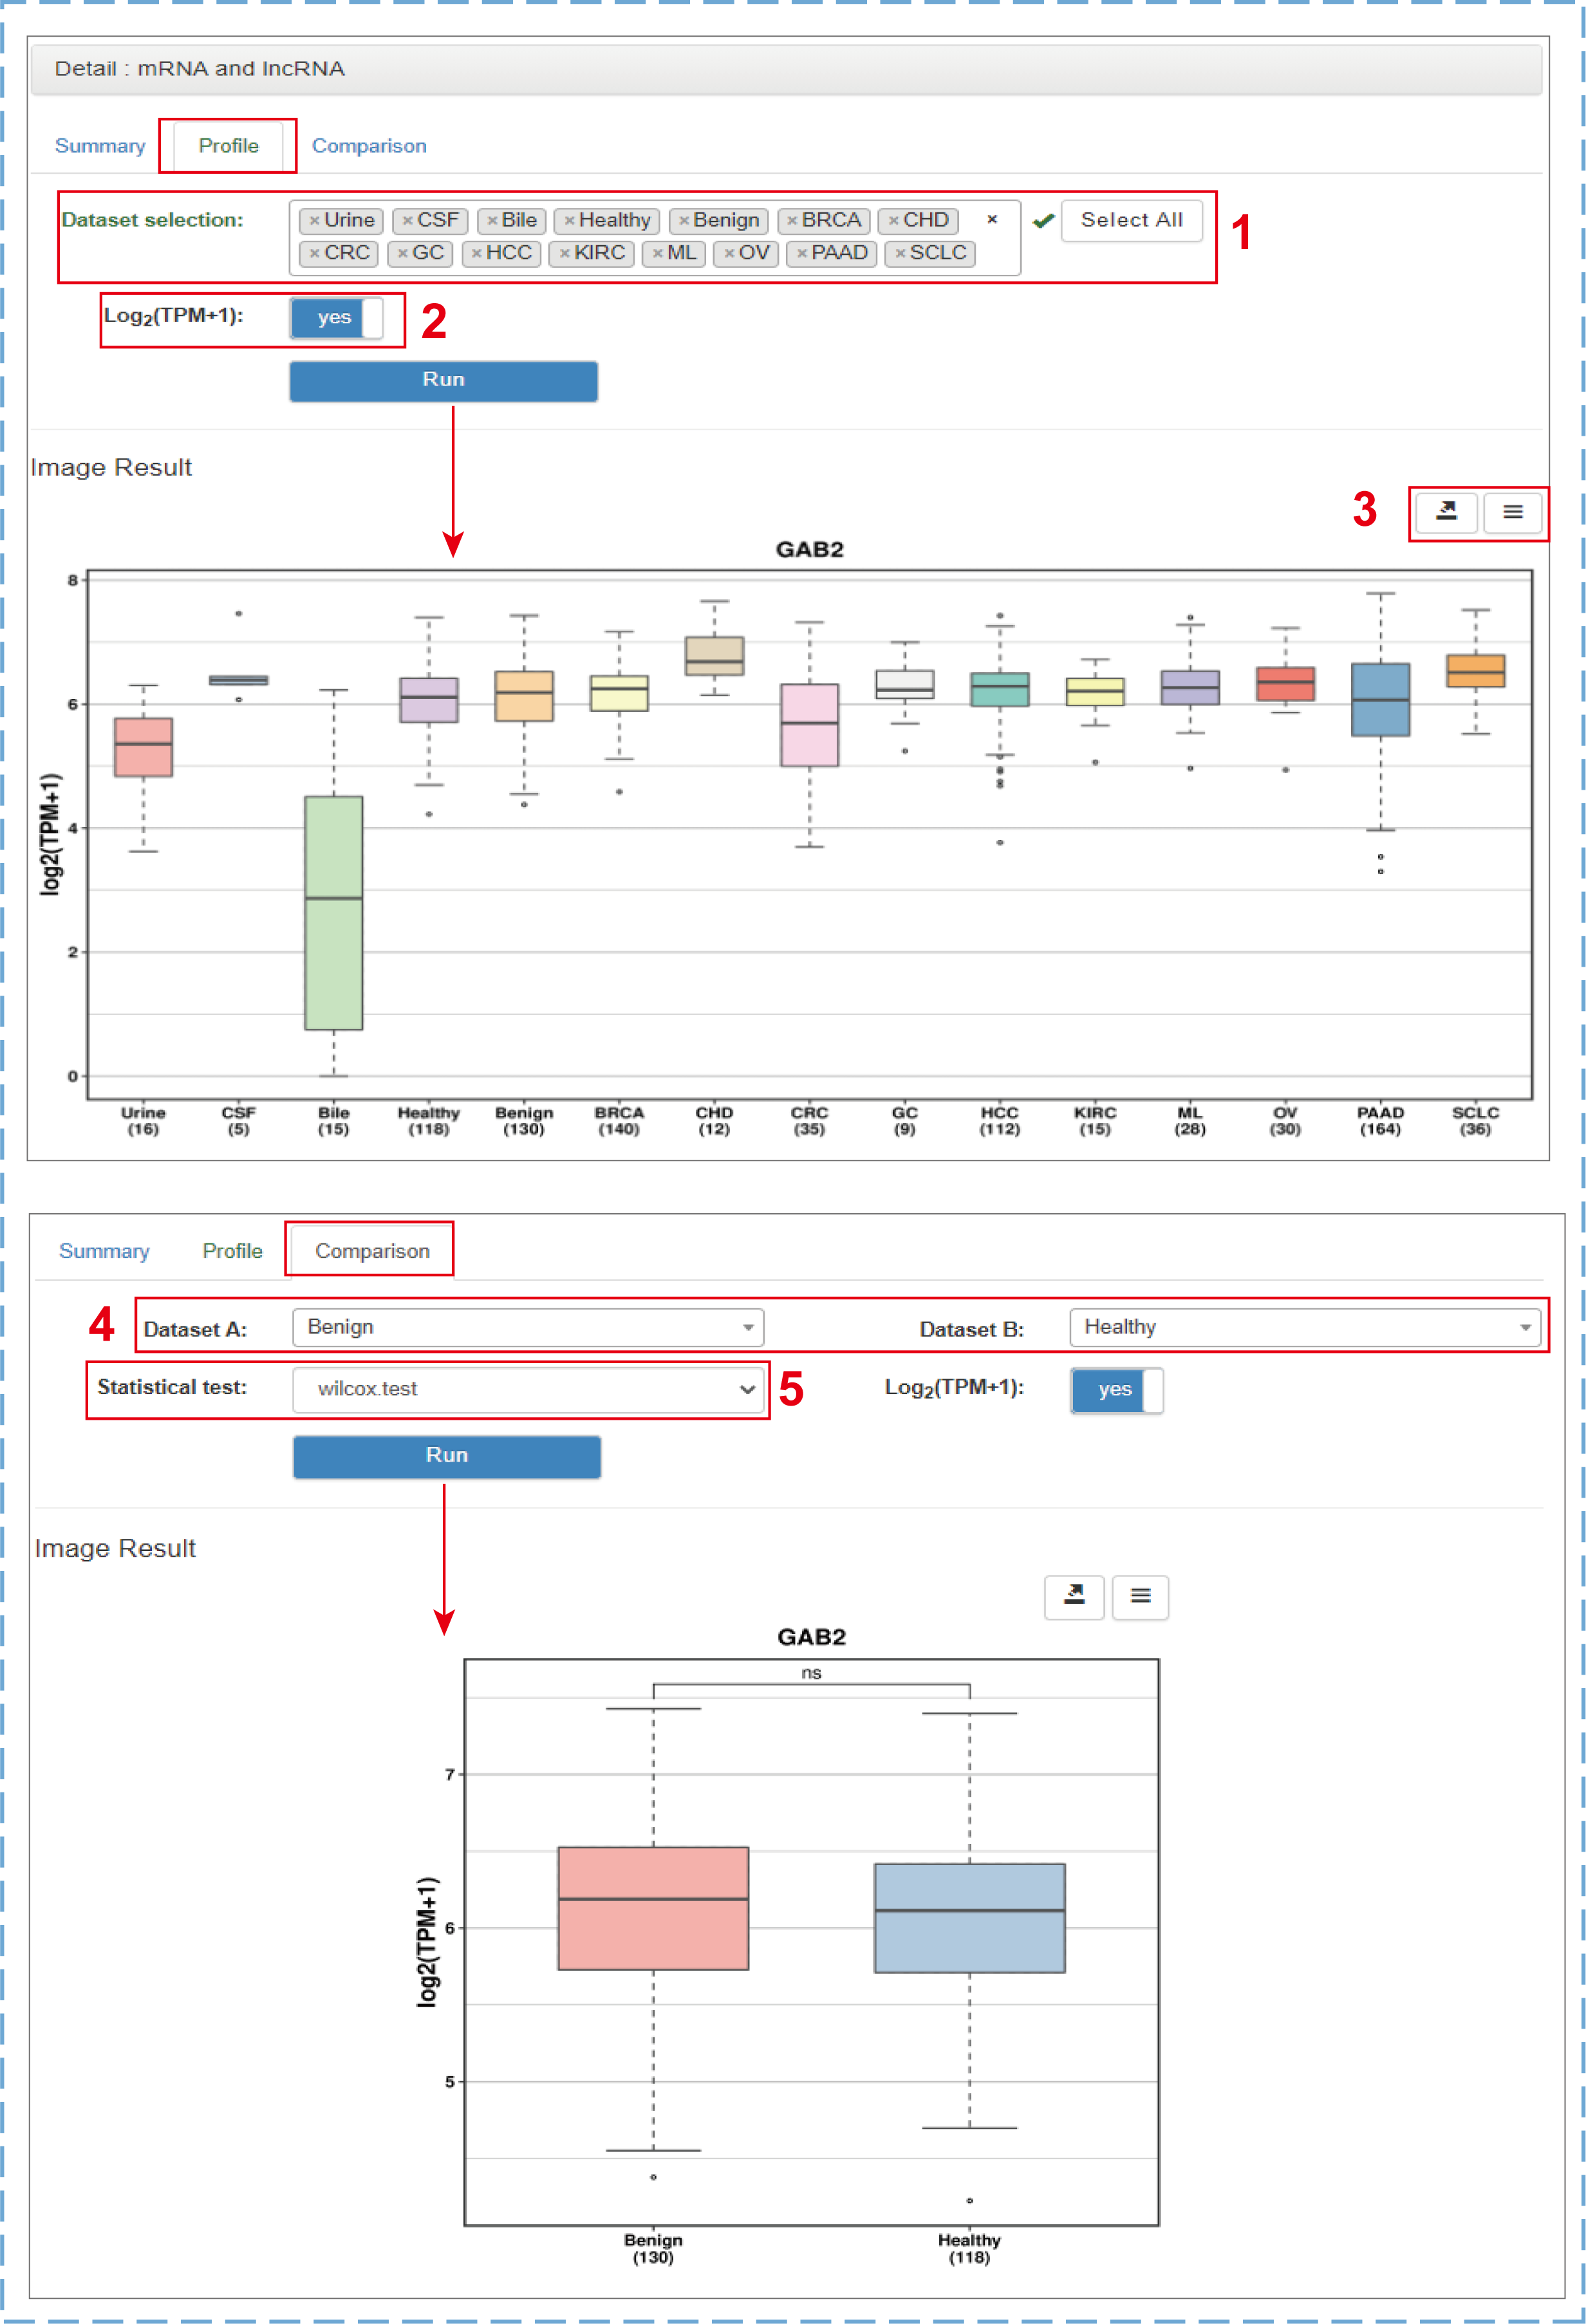
Clicking the gene symbol, circID, pathway ID or tissue/cell name in both browse and search result tables will link to the corresponding detail section that currently includes ‘Summary’, ‘Profile’ and ‘Comparison’ three pages. For exLRs, users can view more comprehensive and detailed annotation information as well as the expression frequencies (sample numbers) and mean expression values in tumor, benign, healthy, urine, CSF and bile samples from the ‘Summary’ page. A few manual options are provided on the ‘Profile’ and ‘Comparison’ pages:
- 1.Selecting datasets of interest to display the expression level (By default, the ESCC, GBM, MEL groups are not displayed are produced by different teams with low mapped read counts. Hence, these data are only used to annotate exLRs detected in such types of samples.);
- 2.Choosing to normalize the expression values or not;
- 3.Downloading the chart and data;
- 4.Choosing two datasets of interest for comparison;
- 5.Selecting a suitable method to test the difference between two groups (Student's t-test for groups with less than 30 samples, Wilcoxon test for groups with more than 30 samples).
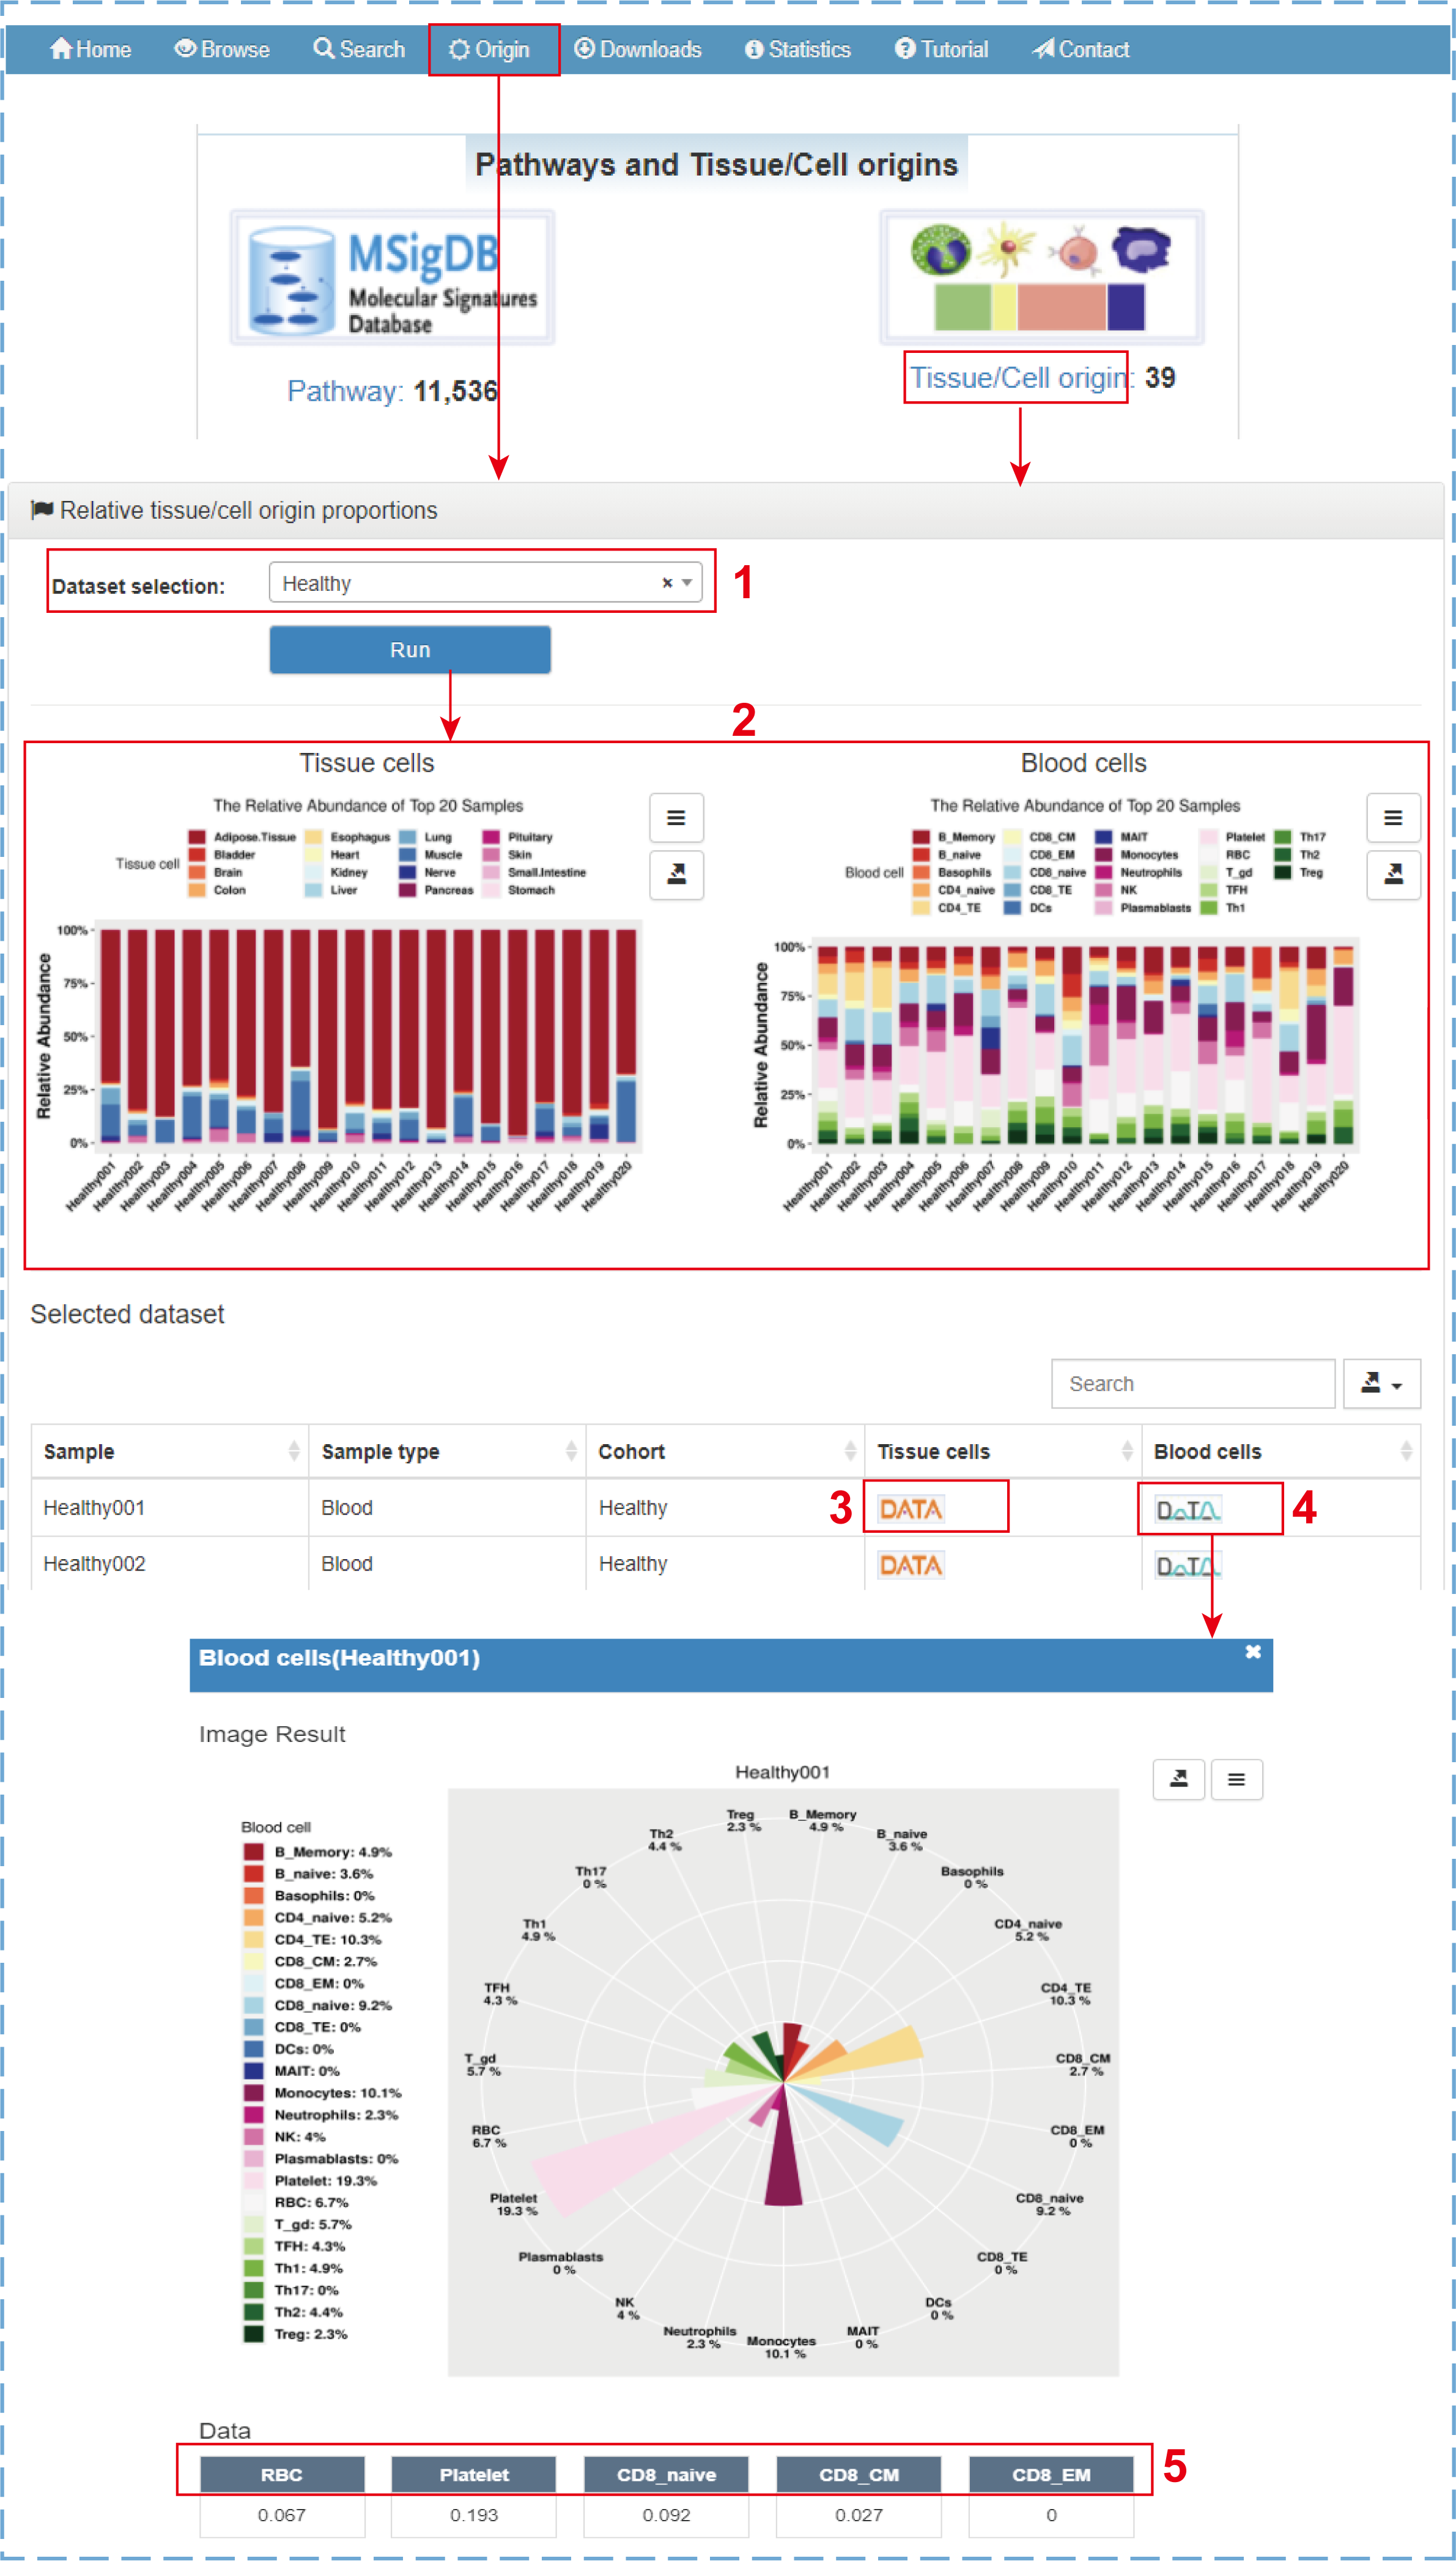
5. The relative proportions of EV origins
ExoRBase 2.0 supports the intuitive visualization not only of the absolute proportions of tissue/cell origins for comparison between different cohorts but also of the relative proportions of tissue/cell origins for comparison between different tissue/cell origins in each sample. By clicking ‘Origin’ on the navigation bar or ‘Tissue/Cell origin’ on the home page, the ‘Relative tissue/cell origin proportions’ page is displayed:
- 1.Selecting a dataset of interest (e.g., Healthy);
- 2.Cumulative percentage charts exhibiting the relative abundances of 16 tissue origins and 23 blood cell origins for the top 20 healthy samples (or all samples of one group with less than 20 samples);
- 3.Clicking to display the relative proportions of tissue origins with a rose polar chart;
- 4.Clicking to display the relative proportions of blood cell origins with a rose polar chart;
- 5.Clicking to link to the detail section of corresponding EV origin.
(1)The calculation of tissue specificity for a mRNA or lncRNA gene:
To assess tissue specificity of a mRNA or lncRNA gene across human tissues, we downloaded the latest release (RNA-seq analysis V8) of gene expression TPM profiles (GENCODE version 26) across 30 tissues in the Genotype-Tissue Expression (GTEx) project. Genes that were lowly expressed (<0.1 TPM) in all tissues were removed. The tissue specificity score was defined as the difference between the logarithm of the total number of tissues and the Shannon entropy of the expression values for a gene. The score for one gene was calculated as follows:
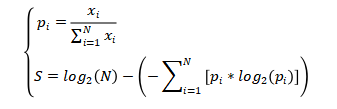
 is the gene expression level in tissue i
, is the total number of all tissues,
is the gene expression level in tissue i
, is the total number of all tissues, stands for the relative frequency.
For each gene, 30 frequency scores (
) and one specificity score were calculated. A gene was defined as tissue-specific when its max frequency score was more than double the second largest one and its specificity score was no less than 1.
(2)Annotating circRNAs to circBase database:
The resource of all human circRNAs were downloaded from circBase database ( http://www.circbase.org/ ). The genomic coordinates of circRNAs were converted to hg38 using the UCSC liftover tool. Then these circRNAs were combined with our collections.
(3)The definition of significant difference between healthy group and other groups:
To characterize the differential expression or enrichment targets, the Mann–Whitney U test was used to separately perform differential analysis between healthy individuals and each disease/tumor cohort. To avoid the impact of sample imbalance on differential analysis, we randomly sampled 35 healthy samples to compare with groups with relatively fewer samples (CHD, CRC, GC, KIRC, ML, OV and SCLC). ExLRs with |log 2FC (fold change)| > 1 and p -value < 0.05 were considered significantly differential targets, and the enrichment results from pathway analyses and EV-origin strategy with p -value < 0.05 were also included in this study. For groups with larger sample sizes (benign, BRCA, HCC, PAAD), the q -values (adjusted using the adjusted Benjamini–Hochberg method) of differential targets were less than 0.05.
The exLR-seq data of ESCC, GBM and MEL blood samples are produced by different teams with low mapped read counts. Hence, these data are only used to annotate exLRs detected in such types of samples, and the differences between the three groups and the healthy group were not taken into consideration.